Civil Engineering Reference
In-Depth Information
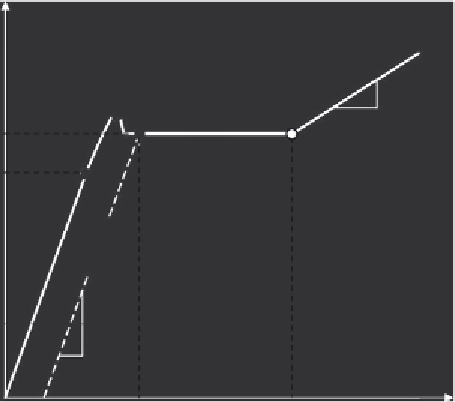
Stress
E
st
f
y
f
p
0.2 %
offset
line
E
s
e
y
e
st
Strain
Figure 2.2 Initial part of the stress-strain curve for steels with a yield plateau.
corresponding to the tensile strength
f
u
. The slope of the stress-strain curve
constantly varies during strain hardening. The tangent slope of the curve at
the onset of strain hardening (
E
st
) is often used for analysis of steel behavior at
high strain levels. Tensile coupon test results are usually presented by engi-
neering stress-strain curves where stress is calculated based on the unde-
formed cross-sectional area of the specimen. As the specimen is loaded,
the cross-sectional area is constantly being reduced, which is known as neck-
ing phenomena. The true stress at any given point can be calculated with
respect to the contracted area at that point in time. In nonlinear structural
analyses, true stress-strain curves should be used.
Figure 2.3
shows typical
f
y
70 ksi (483 MPa) show definite yield plateaus with similar ductility.
The HPS 100W steel does not have a clearly defined yield plateau and shows
slightly lower ductility compared to the lower-strength steels. The amount
of strain hardening decreases with increasing yield strength. The minimum
steel grades included in the A709 specification. Plates with thickness up to
4 in. (101.6 mm) are available in all grades, except for 50S. Rolled shapes are
not available in the HPS grades. The shear yield stress (
f
yv
) can be determined


Search WWH ::

Custom Search