Civil Engineering Reference
In-Depth Information
(principal strains in direction 1-1) contours at failure of the small-scale built-
up I-section plate girder T2 are plotted. It can be seen that the plastic strains
were concentrated at the maximum stresses portions of the web. Further-
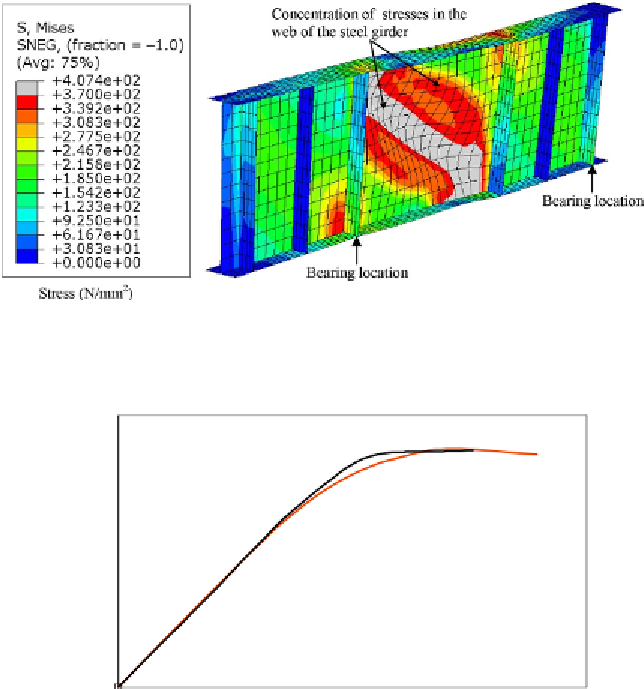
more, in
Figure 6.15
,
the von Mises yield stress contours at failure of the
small-scale built-up I-section plate girder T2 are plotted. It can be seen that
the yield stresses were reached at midspan in the upper and lower flanges.
The load-midspan deflection curves predicted experimentally and numeri-
cally were also compared as shown in
Figure 6.16
.
It can be shown that
Figure 6.15 Stress (von Mises) contours at failure of the small-scale built-up I-section
plate girder T2 (enlarged 5).
2000
1600
1200
800
400
Test
FE
0
0
1
2
3
4
5
6
7
Deflection (mm)
Figure 6.16 Comparison of load-deflection relationships obtained experimentally and
numerically for the small-scale built-up I-section plate girder T2.


Search WWH ::

Custom Search