Environmental Engineering Reference
In-Depth Information
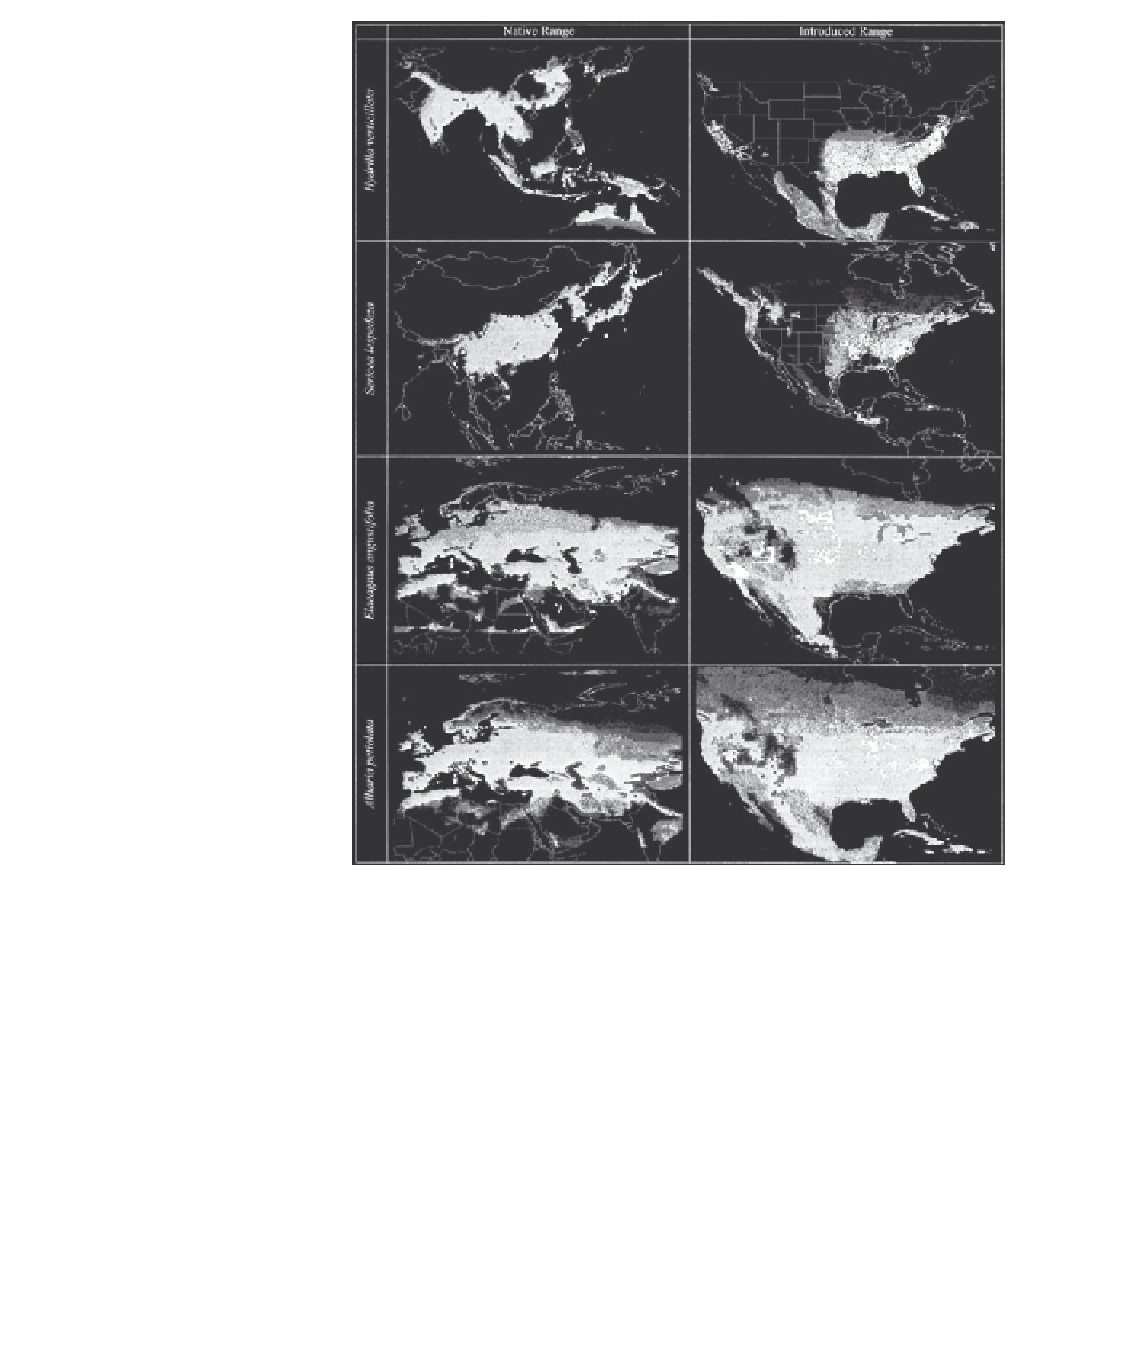
Fig. 2.4
Predictions of
native distributional
areas and potential
invaded distributional
areas for
Hydrilla
verticillata
,
Sericea
lespedeza
,
Elaeagnus
angustifolia
and
Alliaria
petiolata
. The native
areas analyzed were
southern and eastern
Asia for
Hydrilla
,
eastern Asia for
Sericea
and Europe and western
Asia for
Elaeagnus
and
Alliaria
. White symbols
on native distribution
maps indicate occur-
rence data used to build
ecological niche
models. Black polygons
on the introduced
distribution maps
indicate known
occurrences in counties
or river catchment
areas. Increasingly dark
shading indicates
greater confi dence in
prediction of presence
(model agreement).
(From Peterson et al.,
2003.)
particular plants have already invaded North America so we can test the accuracy
of predictions, something it is critical to know if we want to use the same approach
for potential invaders that have not yet arrived.
The projected distribution areas in North America were relatively small for
Hydrilla
and Chinese bush clover but much more extensive for Russian olive and
garlic mustard. In each case, however, there was a high degree of coincidence
between the projected and observed invaded ranges. In the case of
Hydrilla
, for
example, the model successfully predicted occurrence in 201 of the 206 counties
where it is known to have established. Just as important, such models indicate areas
where a species has not established but where there is a high probability it will be
able to do so. Managers can use this kind of information to devise plans to reduce
the likelihood that invaders will arrive in the susceptible locations.


Search WWH ::

Custom Search