Environmental Engineering Reference
In-Depth Information
Table 1.1
Estimated
annual costs (billions of
US dollars) associated
with invaders in the
USA. In each case, the
cost is made up of loss
and damage caused plus
dollars spent to control
the pests. Taxonomic
groups are ordered in
terms of the total costs
associated with them.
(After Pimentel et al.,
2000.)
Number of
Loss and
Control
Total
Type of organism
invaders
Major culprits
damage
costs
costs
Microbes (pathogens)
>
20,000
Crop pathogens
32.1
9.1
41.2
Mammals
20
Rats and cats
37.2
NA
37.2
Plants
5,000
Crop weeds
24.4
9.7
34.1
Arthropods
4,500
Crop pests
17.6
2.4
20.0
Birds
97
Pigeons
1.9
NA
1.9
Molluscs
88
Asian clams, zebra
1.2
0.1
1.3
mussels
Fishes
138
Grass carp, etc.
1.0
NA
1.0
Reptiles, amphibians
53
Brown tree snake
0.001
0.005
0.006
NA, data not available.
(a)
(b)
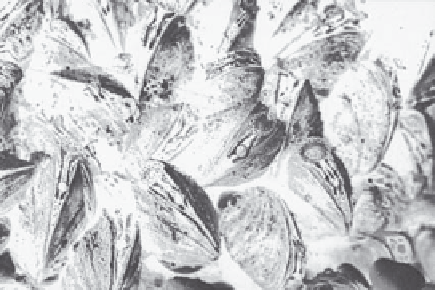
(c)
(a) Yellow star thistle. (© Greg Hudson,
Visuals Unlimited.) (b) Red fi re ants. (©
Visuals Unlimited/ARS.) (c) Zebra mussels.
(© Visuals Unlimited/OMNR.)


Search WWH ::

Custom Search