Environmental Engineering Reference
In-Depth Information
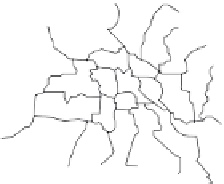
Fig.
10.11
Map showing
study areas along a
transect through the
city of Berlin, Germany.
The total number of
plant species identifi ed
in each area is generally
correlated with the
number of habitat types
(such as wasteland,
park, garden, street
border) with the
exception of the central
city, whose high
biodiversity is mainly
related to a single large
wasteland left undevel-
oped after World War
II. (After Zerbe et al.,
2003.)
Berlin
BERLIN
GERMANY
A
B
C
D
E
F
G
Study areas
10 km
600
Species
Landuse types
25
500
20
400
15
300
10
200
5
100
0
0
Study area
A
B
C
D
E
F
G
City center
Outskirts
No. of species
1-2
3-6
7-12
13-22
23-54
Fig.
10.12
Distribution of biodiversity hotspots, showing numbers of species of globally threatened birds plus amphibians
mapped on an equal area basis (each grid cell is 3113 km
2
). (After Rodrigues et al., 2006.) (This fi gure also reproduced as
color plate 10.12.)


Search WWH ::

Custom Search