Environmental Engineering Reference
In-Depth Information
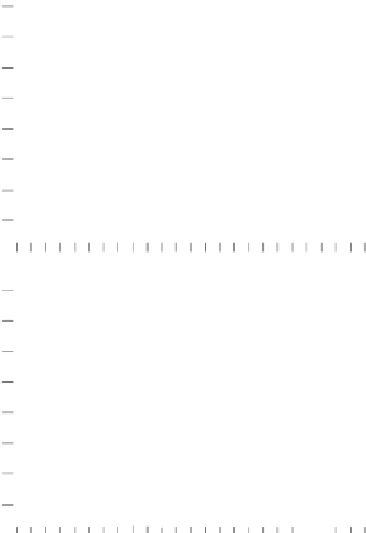
Fig. 9.14
(a) Fingerlings
of two piscivorous fi sh
stocked in Lake
Mendota; the major
biomanipulation effort
started in 1987 (vertical
dotted line). (b)
Estimates of zooplank-
ton biomass consumed
by zooplanktivorous
fi sh per unit area per
day. The principal
zooplanktivore fi sh
were
Coregonus artedi
,
Perca fl avescens
and
Morone chrysops
. Note
that consumption of
zooplankton is reduced
because the piscivorous
fi sh reduce densities of
the zooplanktivorous
fi sh. (c) Mean and range
during summer of the
maximum depth at
which a Secchi disk is
visible (a measure of
water clarity); dotted
vertical lines are for
periods when the large
and effi cient grazer
Daphnia pulicaria
was
dominant. This grazing
zooplankton species
was much more
prominent after
biomanipulation had
allowed zooplankton to
increase in density, and
D. pulicaria
plays a
large role in reducing
the density of phyto-
plankton so that water
clarity increases (Secchi
disk visible at greater
depth). (From Begon et
al., 2006, after Lathrop
et al., 2002.)
(a)
800
Biomanipulation
Walleye
600
400
200
0
1976 78
80
82
84
86
88
90
92
94
96
98
80
Northern pike
60
40
20
0
1976 78
80
82
84
86
88
90
92
94
96
98
(b)
1.6
1.2
0.8
0.4
0
1976 78
80
82
84
86
88
90
92
94
96
98
(c)
0
1
2
3
4
5
6
1976 78
80
82
84
86
88
90
92
94
96
98
Year


Search WWH ::

Custom Search