Environmental Engineering Reference
In-Depth Information
be sustained at a higher level because many males are surplus to requirements when
it comes to producing offspring.
7. 3 .1
'Dynamic pool
models' in fi sheries
management -
looking after the big
mothers
In fi sheries management, age-structured models are known as
dynamic pool
models.
Their general structure is illustrated in Figure 7.9. The submodels (recruitment rate,
growth rate, natural mortality rate and fi shing rate) combine to determine the size
of the fi shed population, the proportion that can be exploited and how this translates
into a yield to the fi shing community. In contrast to the MSY approach, this yield
(as a biomass) depends not only on the number of individuals caught but also on
their size (past growth). Moreover, the catchable biomass depends not on a basic
estimate of surplus recruitment but on a more complex combination of natural
mortality, harvesting mortality, individual growth and recruitment into the age
classes that are targeted. The crucial point is that in the case of the dynamic pool
approach, a harvesting strategy can include not only a harvesting effort, but also
the partitioning of that effort amongst the various age classes present.
A classic example of a dynamic pool model in action concerns the Arcto-Norwe-
gian cod fi shery (
Gadus morhua
) (Garrod & Jones, 1974). The age-class structure of
the cod population in the late 1960s was used to predict, for a period of 25 years,
the effects on yield of different fi shing efforts and different mesh sizes in the trawl
nets. The signifi cance of varying the size of mesh is that the bigger it is, the larger
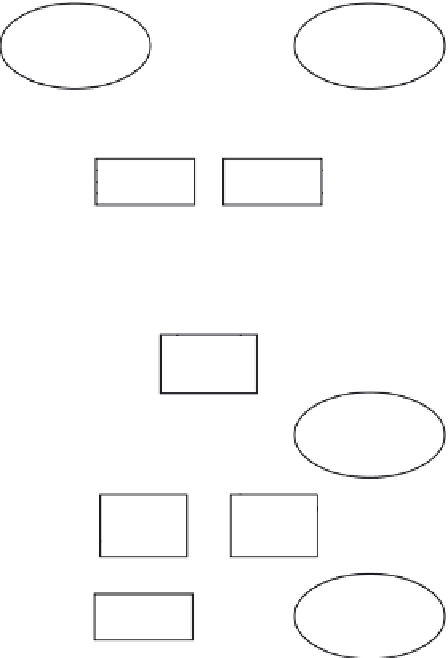
Fig. 7.9
The dynamic
pool approach to fi shery
harvest management,
illustrated as a fl ow
diagram. There are four
main submodels:
growth rate of
individuals, recruitment
rate into the popula-
tion, the natural
mortality rate (other
than from fi shing) and
fi shing mortality rate.
Each submodel can
itself be broken down
into more complex and
realistic systems. Solid
lines and arrows refer
to changes in biomass
under the infl uence of
these submodels.
Dotted lines refer to
external infl uences and
effects of one submodel
on another. Harvest
yields are estimated
under various manage-
ment regimes character-
ized by particular
values inserted into the
submodels. (From
Begon et al., 2006, after
Pitcher & Hart, 1982.)
Environmental
variables
e.g. temperature
Environmental
variables
Growth
rate
Recruitment
rate
Reproduction
Egg survival
Fry survival
and growth
Pre-recruit
survival
and growth
Exploitable
stock
biomass
Environmental
factors
Fishing
mortality
rate
Natural
mortality
rate
Management
Yield to
humans
Predators


Search WWH ::

Custom Search