Environmental Engineering Reference
In-Depth Information
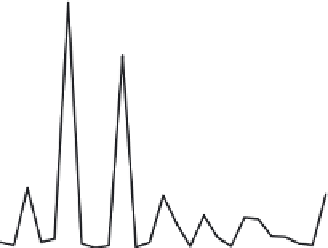
Fig. 7.4
(a) Estimates of
recruitment of young
fi sh and the size of the
spawning stock of
Pacifi c whiting from
1977 to 2001. (b) When
recruitment is plotted
against biomass (a
measure of population
size), there is no sign of
the idealized domed
shape pattern drawn in
Figure 7.2. (After
Ishimura et al., 2005.)
(a)
6
Recruitment
Spawning stock
biomass
12
10
4
8
6
2
4
2
0
0
Year of recruitment
(b)
4
3
2
1
0
0
0.5
1.0
1.5
2.0
2.5
3.0
Spawning stock biomass (million t)
2-year-old fi sh - the youngest stage that can be reliably sampled) and spawning
stock biomass for Pacifi c whiting (
Meluccius productus
). When recr uitment each year
(t he d at a for 2-ye a r- old recruits are shifted back 2 years) is plotted against spawning
stock biomass (a measure of population size
N
), the domed curve we were expecting
is not evident at all (Figure 7.4b). The considerable yearly variation in biomass and,
more particularly, recruitment no doubt refl ect variation in environmental condi-
tions, obscuring any underlying dome-shaped relationship in Figure 7.4b.
Another data-intensive approach to estimate MSY involves the use of historical
records of annual yield against hunting effort because, as noted in Figure 7.3b, MSY
is the maximum yield in a plot of yield against effort. However, even this approach
can be fl awed, as shown in Figure 7.5. In 1975, the International Commission for
the Conservation of Atlantic Tunas (ICCAT) used the available data (1964-73) to
plot the yield-effort relationship for yellowfi n tuna (
Thunnus albacares
) in the
eastern Atlantic. It looked like they had reached the top of the curve - with a sus-
tainable yield of around 50,000 tons. With time, however, effort rose further and it
became clear that the top of the curve had not been reached. A reanalysis in 1985
suggested a sustainable yield of around 110,000 tons. It seems that the top of the
curve has now been achieved, and the MSY is 110,000 tons.
A famous example of the use of fi xed quotas is provided by the Peruvian anchovy
(
Engraulis ringens
), which from 1960 to 1972 was the world's largest fi shery. Fisheries
ecologists advised that the MSY was around 10 million tonnes annually, and regula-
tions were put in place to limit catches accordingly. But the regulations were not
properly enforced, the fi shing capacity of the fl eet expanded and the annual catch
went above 10 million tonnes (Figure 7.6). In 1972 the catch crashed, at least partly


Search WWH ::

Custom Search