Java Reference
In-Depth Information
**28.16
=
(
Induced subgraph
) Given an undirected graph G
(V, E) and an integer
k
, find an induced subgraph H of G of maximum size such that all vertices
of H have a degree
7 =
k
, or conclude that no such induced subgraph exists.
Implement the method with the following header:
public static
Graph maxInducedSubgraph(Graph g,
int
k)
The method returns
null
if such a subgraph does not exist.
(
Hint
: An intuitive approach is to remove vertices whose degree is less than
k
.
As vertices are removed with their adjacent edges, the degrees of other vertices
may be reduced. Continue the process until no vertices can be removed, or all
the vertices are removed.)
***28.17
(
Hamiltonian cycle
) The Hamiltonian path algorithm is implemented in Sup-
plement VI.E. Add the following
getHamiltonianCycle
method in the
Graph
interface and implement it in the
AbstractGraph
class:
/** Return a Hamiltonian cycle
* Return null if the graph doesn't contain a Hamiltonian cycle */
public
List<Integer> getHamiltonianCycle()
***28.18
(
Knight's Tour cycle
) Rewrite KnightTourApp.java in the case study in Sup-
plement VI.E to find a knight's tour that visits each square in a chessboard and
returns to the starting square. Reduce the Knight's Tour cycle problem to the
problem of finding a Hamiltonian cycle.
**28.19
(
Display a DFS/BFS tree in a graph
) Modify
GraphView
in Listing 28.6 to
add a new data field
tree
with a set method. The edges in the tree are dis-
played in red. Write a program that displays the graph in Figure 28.1 and the
DFS/BFS tree starting from a specified city, as shown in Figures 28.13 and
28.16. If a city not in the map is entered, the program displays an error mes-
sage in the label.
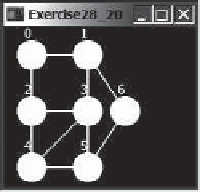
*28.20
(
Display a graph
) Write a program that reads a graph from a file and displays it.
The first line in the file contains a number that indicates the number of vertices
(
n
). The vertices are labeled
0
,
1
, . . . ,
n-1
. Each subsequent line, with the for-
mat
u x y v1 v2 ...
, describes the position of
u
at (
x
,
y
) and edges (
u
,
v1
),
(
u
,
v2
), and so on. Figure 28.24a gives an example of the file for their corre-
sponding graph. Your program prompts the user to enter the name of the file,
reads data from the file, and displays the graph on a pane using
GraphView
, as
shown in Figure 28.24b.
File
7
0 30 30 1 2
1 90 30 0 3 6
2 30 90 0 3 4
3 90 90 1 2 4 5
4 30 150 2 3 5
5 90 150 3 4 6
6 130 90 1 5
0
1
2
3
6
4
5
(a)
(b)
F
IGURE
28.24
The program reads the information about the graph and displays it visually.


Search WWH ::

Custom Search