Environmental Engineering Reference
In-Depth Information
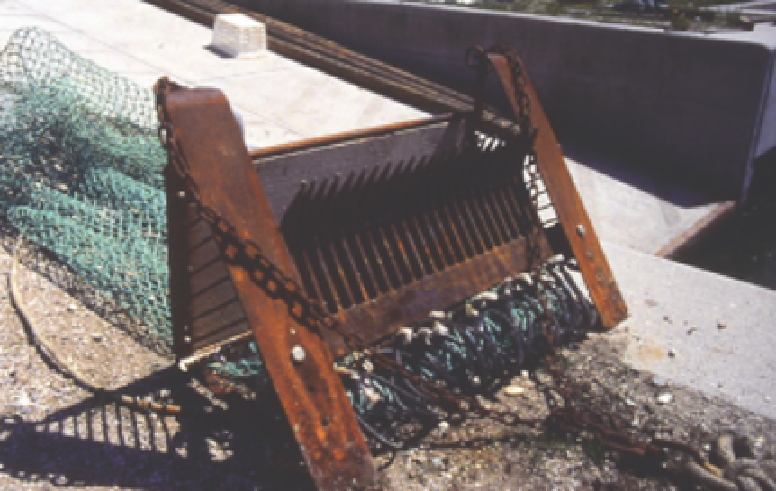
Fig. 3. The “maranese rake”
Fishery
(tons)
Total Manila clam
production (tons)
Year
Shell farm (tons)
%Shell farm
1988 3 3 100
1989 0.9 0.9 100
1990 9 9 100
1991 16 16 100
1992 35 35 100
1993 80 70 150 53
1994 70 150 220 32
1995 30 1,000 1,030 3
1996 60 1,560 1,620 4
1997 25 1,230 1,255 2
1998 140 800 940 15
1999 310 760 1,070 29
2000 911 463 1,374 66
2001 647 641 1,288 50
2002 535 468 1,003 53
2003 595 378 973 61
2004 417 602 1,019 41
2005 680 531 1,211 56
2006 368 300 668 55
2007 375 193 568 66
2008 204 169 373 55
2009 699 145 844 83
2010 772 270 1,042 74
Table 2. Production of Manila clam in tons in the Lagoon of Marano and percentage
contribute of shell farm to the total production


Search WWH ::

Custom Search