Environmental Engineering Reference
In-Depth Information
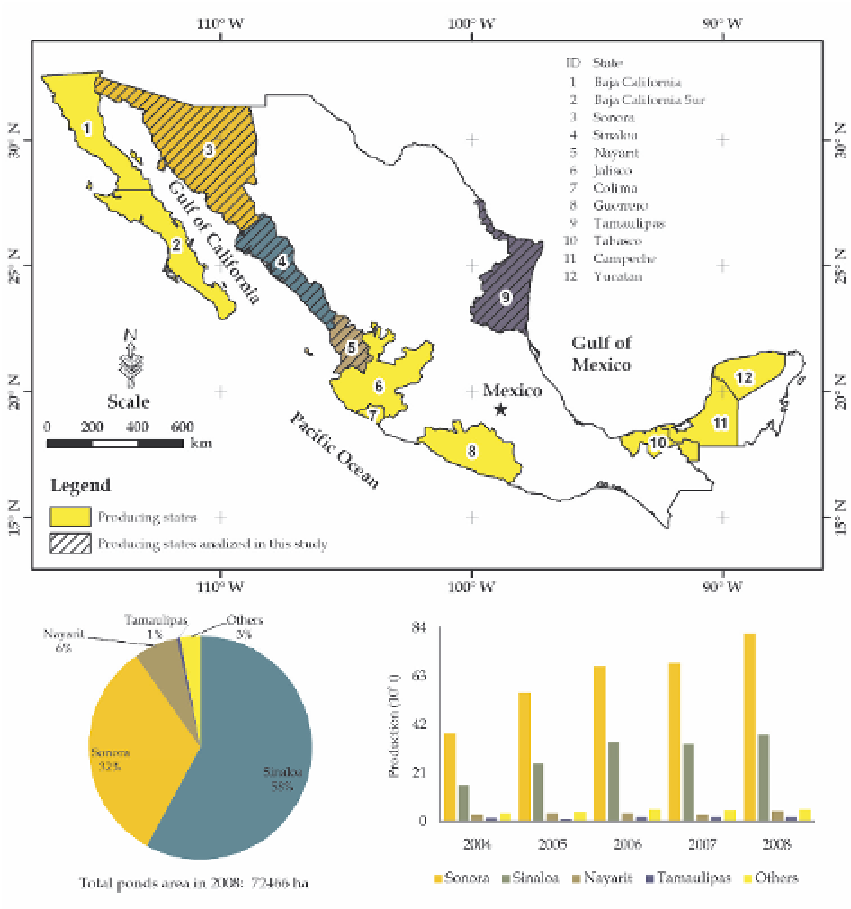
Fig. 2. Shrimp farming in Mexico. The bar graph shows the proportion of pond area by state
and the bar graph shows production by state from 2004 to 2008.
This database was updated and corrected by visual interpretation of the Quickbird and
GeoEye imagery available on Google Earth (2002 to 2011) as well as false-color composites
from Landsat TM (2010 and 2011) and SPOT panchromatic (2010) imagery with a 30 and 2.5
m pixel size (Figure 3).
When the polygons in the four states were completed, a 500 m buffer zone was created
around them using geographic information system (GIS) tools. The farms' area and their
buffer zones were then used to mask the Landsat TM images used in the next step so that
the area outside of them formed a background without spectral information.

Search WWH ::

Custom Search