Environmental Engineering Reference
In-Depth Information
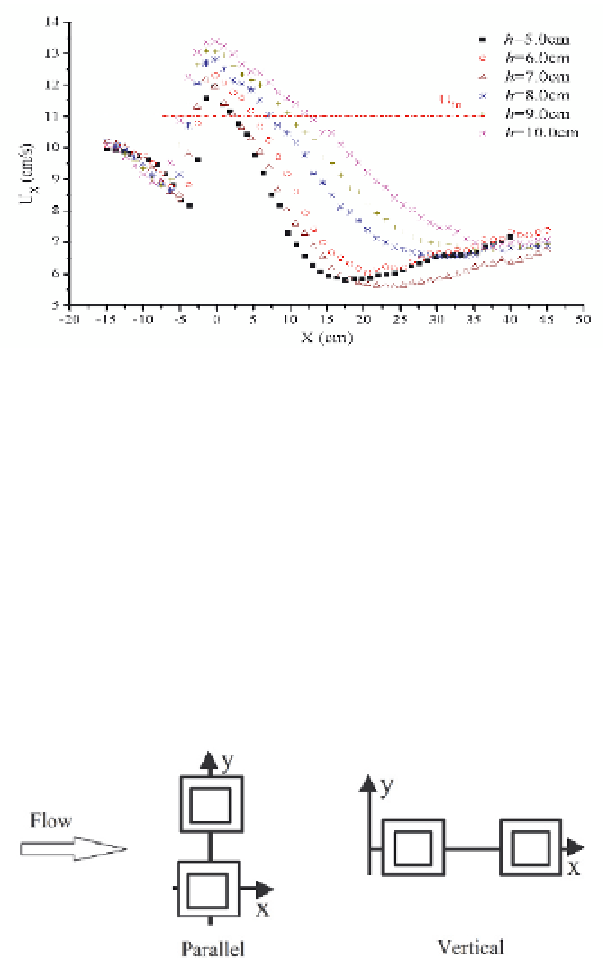
The horizontal flow velocities along the line of y=0 at the horizontal cross-sections of z=1/2
h
are shown in Fig. 15. Similar distributions of flow velocities are found within and around
artificial reefs at different heights. In front of the artificial reef, the horizontal flow velocities
are approximate and decrease gradually when approaching the artificial reefs. Within
artificial reefs, the flow velocities are larger than the inlet flow and peak at the center of the
reefs. In addition, with the increase of the reef height, the maximum horizontal flow velocity
within the reef is also on the increase. At the rear part of the artificial reefs, the flow
velocities show a long-distance attenuation until the locations are sufficiently far away from
Fig. 15. Distribution of the horizontal flow velocities along the line of Y=0 at the horizontal
cross-section of Z=1/2
h
(
h
=5.0, 6.0, 7.0, 8.0, 9.0, 10.0 cm)
the reefs, which are the slow flow regions as mentioned earlier. The smaller the artificial reef
is, the lower the horizontal flow velocity is at the rear of artificial reefs. However, there is a
special phenomenon where the lowest velocity occurs when the reef height is 7.0 cm. In
other words, a preferable slow flow effect is acquired at the reef height of 7.0 cm.
5. Flow field characteristics of two hollow cube artificial reefs
The arrangements of two models of artificial reef are shown in Fig. 16. The spacing of two
parallel combined models is 0.5
h
, 1.0
h
, 2.0
h
and 3.0
h
. The spacing of two vertical combined
models is 1.0
h
, 2.0
h
, 4.0
h
, 6.0
h
, 8.0
h
, 10.0
h
and 12.0
h
(
h
=7.5 cm).
Fig. 16. The arrangements of two hollow cube artificial reefs

Search WWH ::

Custom Search