Environmental Engineering Reference
In-Depth Information
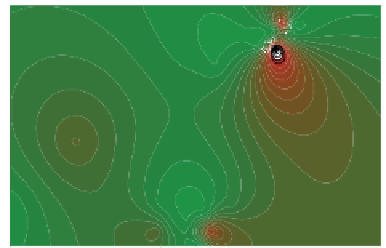
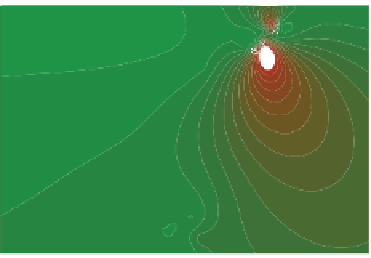
Figure 12.6.
Tox-map (of
the study site) constructed
time course of
bioremediation, leading
from a highly toxic to a
virtually non-toxic site. Each
step was linked to use of the
manipulations coupled to
microbial biosensor testing
detailed in
Fig. 12.1
to
progressively identify
constraints to
bioremediation and
alleviate them through site
engineering.
Figure 12.6
therefore represents a time
course of bioremediation at
the site as various
constraints were alleviated
and the bioremediation
proceeded progressively
further. At the start of the
time course, the tox-map
highlights that there were
three particularly toxic
areas of the site (designated
by increasingly bright red)
which are delineated by a
yellow boundary
representing site material
that is too toxic for
degradation by
micro-organisms
(predominantly BTEX
degrading bacteria) and
hence for any intrinsic
bioremediation to occur.
100
1200
95
90
85
80
1000
75
70
65
800
60
55
50
600
45
40
35
400
30
25
20
15
200
10
5
0
400
600
800
1000
1200
1400
1600
1800
2000
100
95
1200
90
85
80
1000
75
70
65
800
60
55
50
45
600
40
35
30
400
25
20
15
200
10
5
0
400
600
800
1000 1200
1400 1600
1800
2000
105
1200
100
95
90
85
1000
80
75
70
800
65
60
55
600
50
45
40
35
400
30
25
20
200
15
10
5
400
600
800
1000 1200
1400 1600
1800
2000
0
100
1200
95
90
85
1000
80
75
70
65
800
60
55
50
600
45
40
35
400
30
25
20
15
200
10
5
400
600
800
1000 1200
1400 1600
1800 2000
0