Environmental Engineering Reference
In-Depth Information
120
100
80
60
40
20
0
0
10
20
30
Days
40
50
60
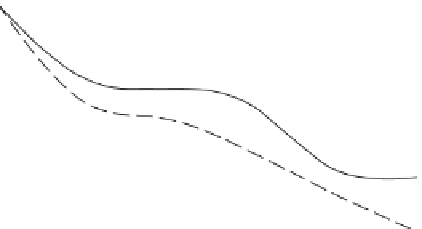
Figure 12.7.
Monitoring of hydrocarbon degradation rates (as a percentage of original
hydrocarbon concentration) across the different windrows of the site. Each symbol
represents a different windrow on the site, and the data for each point are the mean
of 5 observations.
this was simply achieved by measuring oxygen uptake and carbon dioxide
evolution by the soil, as well as monitoring reduction in hydrocarbon concen-
tration). When the O
2
consumption/CO
2
evolution rates decreased markedly,
the windrows were turned mechanically to introduce air and oxygenate the
microbial degraders throughout the anatomy of the windrow.
Conclusions
In this chapter, understanding of the potential of key species of the soil
microbial community responsible for certain metabolic pathways has been
exploited to bioremediate a range of industrial site contaminants. This also
involved using modern, molecular methods to identify and alleviate con-
straints to their bioremediative activity. Some of these constraints are due to
the site contaminants themselves and some are due to the inherent physico-
chemical nature of the microbial habitat. The importance of understanding
and exploiting the microbial ecology of contaminated land has therefore been
highlighted, and, by drawing on two contrasting case studies (one employing
in situ bioremediation and the other ex situ bioremediation), it has been demon-
strated that sustainable approaches to remediation of many contaminated
sites, particularly where hydrocarbons are the dominant contaminants, can


