Environmental Engineering Reference
In-Depth Information
Chloroperlidae
Nemouridae
Leuctridae
Polycentropodidae
Taeniopterygidae
Lepidostomatidae
Perlodidae
Simuliidae
Gyrinidae
Philopotamidae
Planariidae
Goeridae
Limnephilidae
Sericostomatidae
Chironomidae
Tipulidae
Hydropsychidae
Elmidae
Rhyacophilidae
Oligochaeta
Heptageniidae
Hydrophilidae
Scirtidae
Dytiscidae
Baetidae
Odontoceridae
Erpobdellidae
Perlidae
Leptoceridae
Ancylidae
Caenidae
Hydrobiidae
Sphaeriidae
Psychomyiidae
Coenagrionidae
Ephemerellidae
Sialidae
Calopterygidae
Glossiphoniidae
Leptophlebiidae
Gammaridae
Hydroptilidae
Lymnaeidae
Corixidae
Haliplidae
Asellidae
Valvatidae
Planorbiidae
Piscicolidae
Physidae
Ephemeridae
1.0
5
5.5
6
8.5
6.5
7
8
7.5
-1.
-1.0
1.0
-1
- 0.5
0
0.5
1
Low pH intolerant
pCCA axis 1
Low pH tolerant
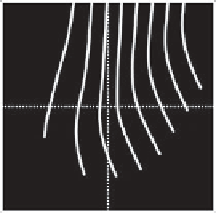
Figure 6.2.
The position of AWIC taxa along axis 1 of a partial CCA with mean pH as the
sole explanatory variable and altitude (m), slope (mkm
1
) and distance from source (km)
as co-variables. Horizontal bars indicate the width of the distribution (standard
deviation) around each taxon score. Aggregated families are shown by their primary
(reproduced from Davy-Bowker et al.
2005
).