Environmental Engineering Reference
In-Depth Information
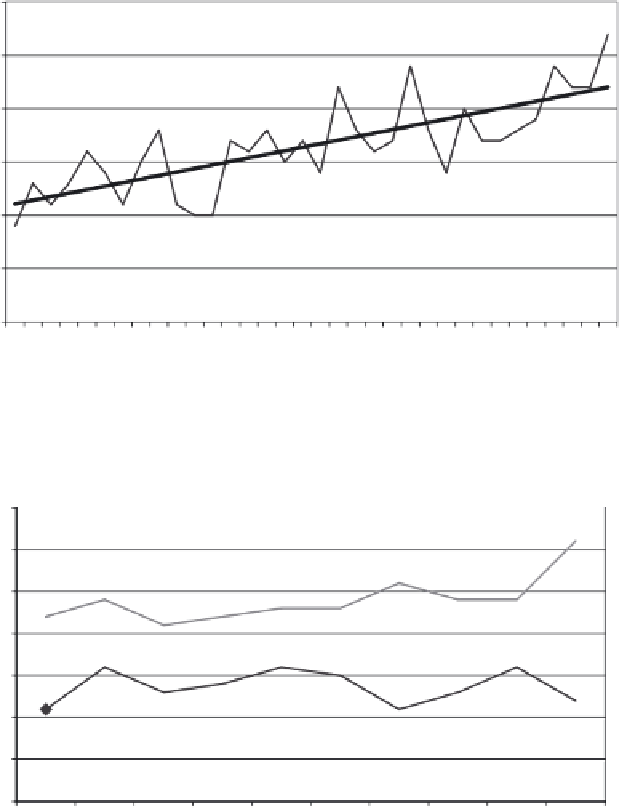
28.0
27.5
y
= 0.0332
x
+ 26.074
27.0
26.5
26.0
25.5
25.0
Source: Meteorological Services Dept, Accra
Figure 4.6 Annual mean temperature at Koforidua (1965-1998)
26.5
1965
−
1974
1989
1998
−
26.0
y
= 0.0655
x
+ 25.04
25.5
25.0
y
=
−
0.0006
x
+ 24.373
24.5
24.0
23.5
23.0
1
2
3
4
5
6
7
8
9
10
Number of years
Source: Meteorological Services Dept, Accra
Figure 4.7 Annual mean temperature at Akropong (1965-1974 and 1989-1998)
species such as
emere
,
wawa
, and
odupko
. Others include lower rainfall reliabil-
ity and a shift in the planting season. They also reported that the traditional signs
of the start of rainy season are no longer reliable. Rivers dry up earlier in the dry
season than in times past, and some hitherto seasonal rivers have dried up
completely.