Environmental Engineering Reference
In-Depth Information
2,500
2,000
1,500
y
=
−
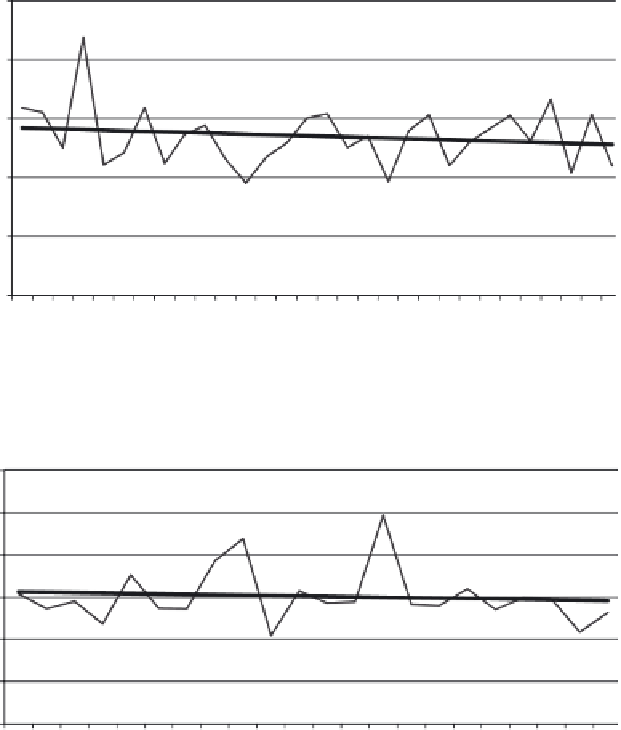
4.8044
x
+ 1423.5
1,000
500
0
Source: Meteorological Services Dept, Accra
Figure 4.3 Annual rainfall fluctuations and trend at Koforidua (1965-1994)
3,000
2,500
2,000
y
=
−
4.8447
x
+ 1568.8
1,500
1,000
500
0
Source: Meteorological Services Dept, Accra
Figure 4.4 Annual rainfall fluctuations and trend at Suhum (1942-1976)
Figures 4.5-4.6 show mean annual temperatures for Koforidua, Figure 4.7 for
Akropong, and Figure 4.8 for Aburi. All the trend line equations for the 1980s
show positive
x
-values indicating rising temperatures. The national mean temper-
ature has also changed from about 25 °C in the mid-1970s to about 27 °C in
recent times (Benneh and Dickson, 1977). A comparison of rainfall and temper-
ature for the three stations reveals an upward temperature trend and a downward
rainfall trend. This may lead to increased evapotranspiration rates.
Figures 4.9 and 4.10 show the mean water balance for Koforidua over the periods
1972-1981 and 1991-1998. It was computed on the basis of mean monthly rainfall