Environmental Engineering Reference
In-Depth Information
Results
Species composition
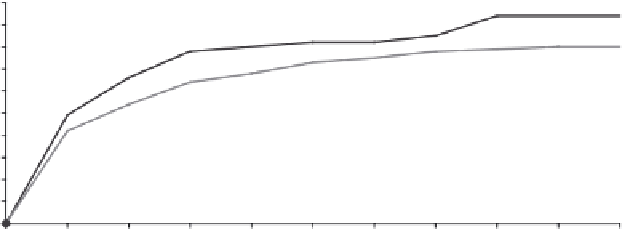
In both countries, sampling proved effective and efficient as is evident in the
species/area curves (Figure 16.2). Species richness in the plots studied was higher
in Ghana (103) than in Guinea (82).
Altogether, 38 similar species observed in the fields of the two countries and their
frequency distribution were estimated (Tables 16.1 and 16.2) and graphically pre-
sented (Figures 16.3 and 16.4). The following common woody trees occur more
frequently in Guinea than in Ghana:
Afzelia africana
,
Annona senegalensis
, and
Terminalia albida
. By contrast, species such as
Vitex doniana
,
Lannea nigricans
,
and
Combretum ghasalens
are higher in relative frequency of occurrence in Ghana.
However, there appeared to be very little difference in the relative frequencies of the
woody species
Vitellaria paradoxa
,
T. albida
,
Strychnos spinosa
,
Ficus sur
,
Cussonia djalonensis
, and
Cassia siberiana
in the plots that were inventoried in the
two countries.
The cumulative frequencies of both woody and non-woody species in the plots
studied were nearly similar and normally distributed (Table 16.2). However, the
spread in occurrence of comparable plant species in the sample plots in the two
countries show differences in shape and height models. Their histogram plots
indicate quantitatively variable species occurrence. The valid frequencies fall
within commonly distributed intervals with similar peak centres (Figs 16.3 and
16.4). The mean species similarity in sample plots of the two countries is esti-
mated to be 50
2 per cent (Tables 16.3 and 16.4).
100
90
80
70
60
Similarity of species per plot
Mean/S.E
(Ghana)
= 50/2%
Mean/S.E
(Guinea)
= 50/2%
50
40
30
20
10
0
0
1
2
3
4
5
6
7
8
9
10
Area (
0.04 ha)
Guinea
Ghana
Figure 16.2 Comparative plant species richness.