Geology Reference
In-Depth Information
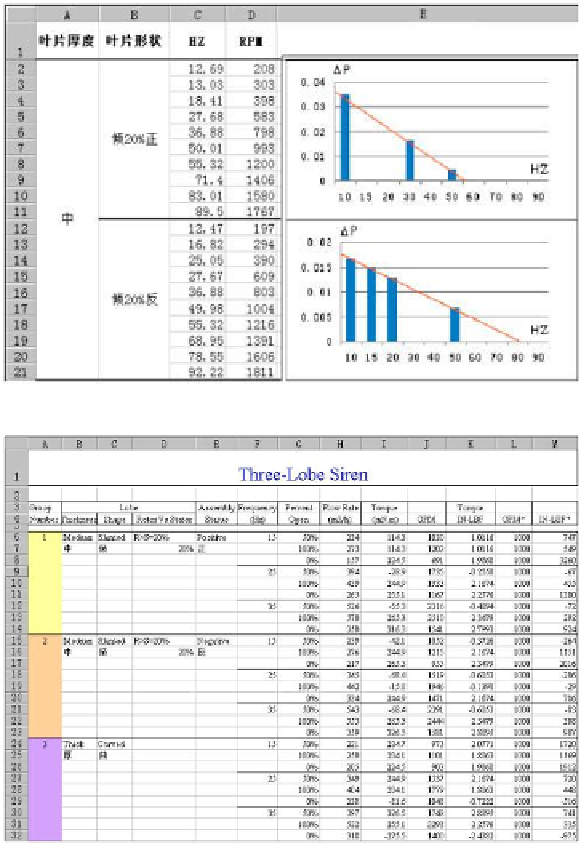
Figure 1.6a.2.
Siren 'p signal strength vs Z at with flow rate fixed.
Figure 1.6a.3.
Siren torque versus Z at with flow rate fixed.
In Figure 1.6b, pressure data from the near transducer in Figure 1.5m
appears at the left, while data from two far transducers in Figure 1.5n are shown
at the center and right. At the left, the pure sinusoid shows that high-order
harmonics have been completely eliminated by the siren design. The two right
figures, which contain additive noise, are almost identical. Multiple transducer
signal processing in Figure 1.6c shows how the red signal is successful extracted
from the blue and green to match the black upgoing waveform.

Search WWH ::

Custom Search