Geology Reference
In-Depth Information
executes, it creates two output files, SAS14.DAT and MYFILE.DAT. The first
is a text file with a “plain English” summary. The second is a data file used for
plotting. To plot results, run the program FLOAT32, which will give the results
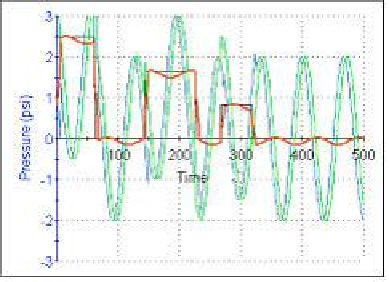
in Figure 10.6a where an index related to time appears on the horizontal.
Figure 10.6a
. Recovery of three step pulses from noisy environment.
In Figure 10.6a, black represents the clean upgoing MWD three-pulse
original signal. Red is the recovered pulse - this result is so good that it
partially hides the black signal. The green and blue lines are pressure signals
measured at the two pressure transducers, again separated by thirty feet. From
these two traces individually, one would not surmise that the red line can be
recovered; the green and blue signal curves differ only through minor “bumps.”
The algorithm handles very small signal-to-noise ratios extremely well. Below,
we take the foregoing three-pulse signal as input again; a noise amplitude of 200
is assumed, so that the S/N ratio ranges from 0.025 to 0.075, all of which are
small. Calculated results in Figure 10.6b again show excellent signal recovery.
Downward propagating noise (psi) assumed as
N(x,t) = Amplitude * cos {2Ŧ f (t + x/c)} ...
o Enter noise freq "f" (hz):
5
o Type noise amplitude (psi):
200
o Enter sound speed c (ft/s):
5000
o Mean transducer x-val (ft):
1700
o Transducer separation (ft):
30
Search WWH ::

Custom Search