Geology Reference
In-Depth Information
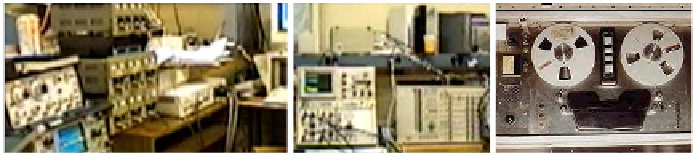
Figure 9.13 shows standard laboratory instrumentation, e.g., spectrum
analyzers, digital oscilloscopes, strip chart recorders and computers used to
control siren rotor actions, and to record multi-channel pressures at piezoelectric
transducers installed along the tubing. The tape recorder is used to play back
noise sources obtained during actual drilling jobs. Our controls also allow us to
evaluate, in real time, the performance of new software filters such as those
developed in earlier chapters, e.g., echo and noise cancellation algorithms using
multiple transducer methods like those in Chapter 4.
Figure 9.13.
Siren control and signal processing station.
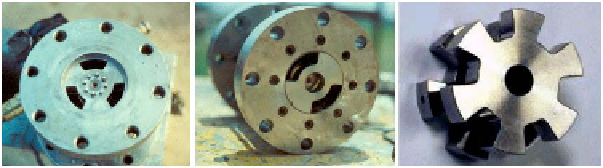
Installed in our test section may be different prototype sirens, e.g., the two,
three and six lobe sirens shown in Figure 9.14. These tests aimed at answering
the following questions. For a given signal frequency, is it best to rotate a two-
lobe siren quickly or a six-lobe siren slowly? What are the signal strength
consequences? What are the harmonic contents of the signals? What are the
relative acoustic efficiencies? Figure 9.15 clearly demonstrates the existence of
higher order harmonics when the rotor turns at constant frequency.
Figure 9.14.
Siren test concepts, test section for both air and mud.
Figure 9.15.
Measured frequency-shift-keying and periodic signals
(not quite the perfect sinusoids shown in common illustrations
!
).

Search WWH ::

Custom Search