Geology Reference
In-Depth Information
In summary, we have described relationships for physical variables
important to turbine design and demonstrated their implementation in
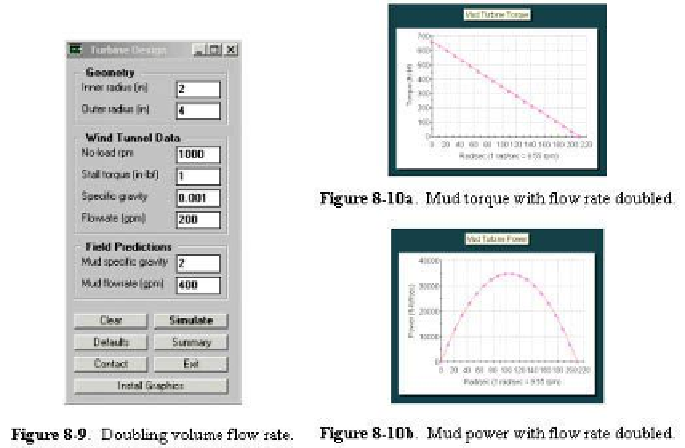
“turbine.exe” (the Fortran engine is contained in calc-5.for). As noted, once
geometric parameters and wind tunnel test results are entered, the program plots
wind tunnel performance curves; also, for mud densities and mud flow rates
chosen by the user, the program will plot the corresponding torque and power
curves versus rotation rate.
Formulas for the two turbine rotation rates that correspond to a fixed level
of desired power are given in Equation 8.6 while the maximum power available
is given in Equation 8.7. Again, the numbers used to demonstrate the software
do not represent real tests, but were selected for illustrative purposes only. We
emphasize that it is not important to run wind tunnel tests at any particular
speed, so long as that speed can be measured accurately; our conversion routines
provide mud results whatever wind speed is used in the testing. Our fast
calculations are almost instantaneous and do not involve iterative methods.
Finally, we give examples from actual MWD turbine hardware tests in
mud, to augment our discussions on wind tunnel measurement in the laboratory.
Figure 8.11 plots stall torque versus flow rate and correctly shows a parabolic
dependence on speed. Figure 8.12 plots no-load rotation rate versus volume
flow rate - measurements for a steel turbine in mud and a plastic mockup in air
correctly fall on the same straight line. Also, the power curves in Figure 8.13
clearly follow the inverted parabolic trend as do measured data. Torque results
in Figure 8.14 for mud and air agree with predicted straight-line trends and
correctly scale with “UU
2
” as is demonstrated from theory.
Search WWH ::

Custom Search