Agriculture Reference
In-Depth Information
a
Development senescence of
Arabidopsis thaliana
b
Transcript changes during leaf senescence
SAG12
SDGs
12.0
8.0
CAB1
RBCS1A
6.0
8.0
4.0
4.0
2.0
0.0
0.0
-2.0
-4.0
-4.0
-8.0
-6.0
-12.0
-8.0
1234
1
2
3
4
Stage1
Stage2
Stage3
Stage4
stage
stage
c
Metabolite changes during leaf senescence
Chlorophyll
M
G
DGs (12 species)
D
G
DGs (14 species)
T
AGs (38 species)
3.0
6.0
4.0
6.0
3.0
2.0
4.0
4.0
2.0
1.0
2.0
2.0
1.0
0.0
0.0
0.0
0.0
-1.0
-1.0
-2.0
-2.0
-2.0
-4.0
-4.0
-2.0
-3.0
-3.0
-6.0
-4.0
-6.0
1
2
3
4
1
2
3
4
1
2
3
4
1
2
3
4
Protein
A
AAs and BCAAs
As
p
, Asn, Glu, Gln, Arg
Stress AAs
2.0
5.0
4.0
2.0
Asp
Asn
Glu
Gln
Arg
4.0
1.5
1.5
3.0
3.0
1.0
1.0
2.0
2.0
0.5
0.5
1.0
1.0
0.0
0.0
0.0
0.0
Leu
Val
Ile
Trp
Tyr
Phe
-1.0
-0.5
-0.5
-1.0
Pro
beta-Alanine
GABA
-2.0
-1.0
-1.0
-2.0
-3.0
-1.5
-3.0
-1.5
-4.0
-2.0
-5.0
-2.0
-4.0
1
2
3
4
1
2
3
4
1
2
3
4
1
2
3
4
Sugars
Nutrient ions
Me
t
-glucosinolates
Anthocyanin
6.0
3.0
4.0
3.0
4MSOB
5MSOP
6MSOH
7MSOH
8MSOO
4MTB
Sulfate
Nitrate
Phosphate
3.0
4.0
2.0
2.0
2.0
2.0
1.0
1.0
1.0
0.0
0.0
0.0
0.0
-1.0
-2.0
-1.0
-1.0
Sucrose
Glucose
Fructose
-2.0
-4.0
-2.0
-2.0
-3.0
-6.0
-3.0
-4.0
-3.0
1
2
3
4
1
2
3
4
1
2
3
4
1
2
3
4
stage
stage
stage
stage
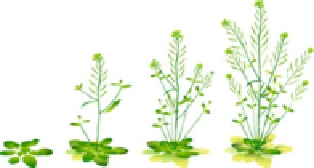
Fig. 8.2 Developmental senescence of
Arabidopsis thaliana
.(a) The senescence process in
Arabidopsis
is schematically depicted to illustrate the changes accompanied with progressing
senescence during the life cycle for a whole plant. A commonly visible phenotype is the
development of leaf chlorosis due to degradation of chlorophyll in the leaves. The Fig. is modified
from Watanabe et al.
2013
(
www.plantphysiol.org.
; Copyright American Society of Plant Biolo-
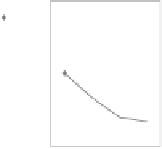
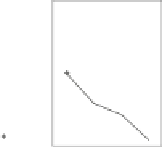
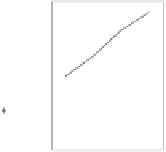
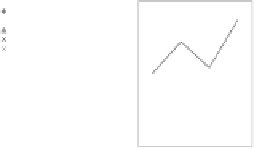
gists). (b) Genes associated with senescence belong to various functional classes. Typical senes-
cence associated genes (SAGs, induced upon senescence) and genes down regulated during
senescence (SDGs) are used as markers for senescence in plants. Expression changes of SAG12
and two
SDGs
,
CAB
and
RBCS1A
, are presented here for an individual life cycle of
Arabidopsis
thaliana
as fold change to stage 1 in log2 scale. No change to stage 1 is indicated by the
dashed
line
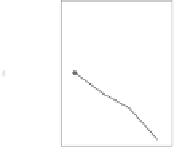
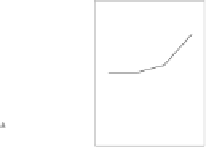
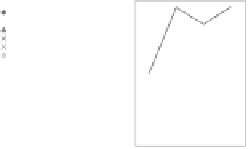
, decrease by negative and increase by positive values. (c) Metabolite changes during leaf
senescence are depicted. Metabolite contents in rosette leaves during developmental senescence