Environmental Engineering Reference
In-Depth Information
10
−
9
m
2
/s, and assuming saturated
As an example, taking
θ
s
=
0.37 and
D
o
=
10
−
9
m
2
/s.
or nearly saturated conditions (i.e.
θ
=
θ
s
=
0.37), then
D
=
0.72
×
18.3.1.2 Dispersion
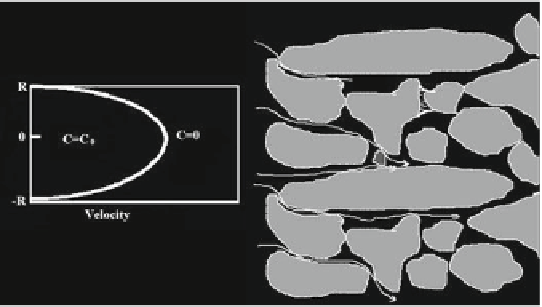
Dispersive transport of contaminants results from the heterogeneous distribution
of water flow velocities within and between different soil pores (Fig.
18.12
,left).
Dispersion can be derived from Newton's law of viscosity which states that veloc-
ities within a single capillary tube follow a parabolic distribution, with the largest
velocity in the middle of the pore and zero velocities at the walls (Fig.
18.12
,left).
For this reason contaminants in the middle of a pore will travel faster than contam-
inants that are farther from the center. Since the distribution of contaminant ions
within a pore depends on their charge, as well as on the charge of pore walls,
some contaminants may move considerably faster than others. In some circum-
stances (e.g., in fine-textured soils), anion exclusion may occur. Since the anions
in such soils are located predominantly in the faster moving liquid in the center
of a pore away from the negatively charge solid surface, anionic contaminants
may travel faster than the average velocity of water (e.g., Nielsen et al.
1986
).
Based on Poiseuille's law, one can further show that velocities in a capillary tube
depend strongly on the radius of the tube, and that the average velocity increases
with the radius to the second power. Since soils consist of pores of many different
diameters, contaminant fluxes in pores of different diameters will be significantly
different, with some contaminants again traveling faster than others (Fig.
18.12
,
right). Furthermore, contaminants may travel according to pathways of different
length. All these factors result in a bell-shaped distribution of velocities and thus of
arrival times, typical of a breakthrough curve.
slow velocity
fast velocity
short
pathway
long
pathway
Fig. 18.12
Distribution of velocities in a single pore (
left
) and distribution of velocities in a pore
system (
right
) resulting in different arrival times of contaminants (modified from Šimunek and Van
Genuchten 2006)


Search WWH ::

Custom Search