Environmental Engineering Reference
In-Depth Information
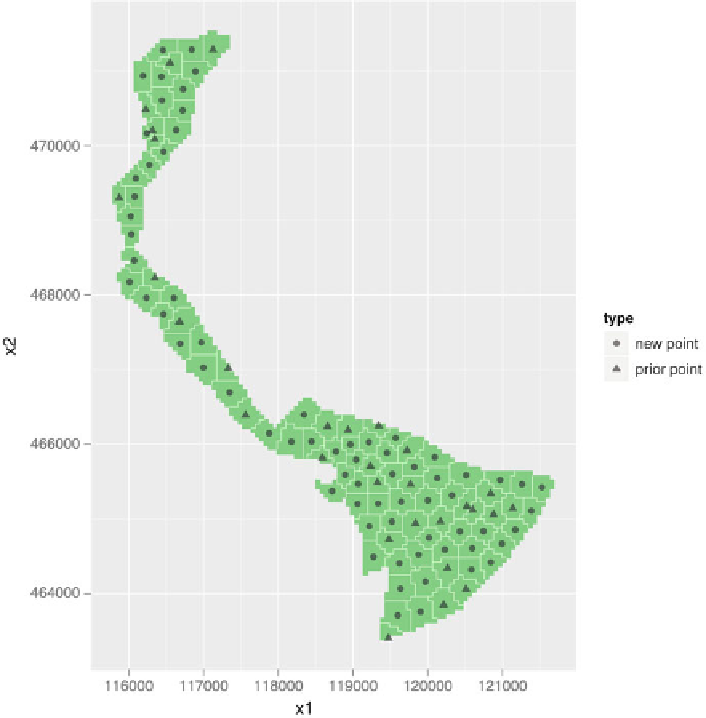
Fig. 4.8
Spatial infill sample of 100 locations obtained by minimizing the Mean Squared Shortest
Distance with the k-means clustering algorithm, for mapping heavy metal concentrations at
Mijdrecht. The prior sampling locations are the stratified simple random sampling locations of
the reconnaissance survey for estimating the spatial cumulative distribution function, see Fig.
4.2
.
Infill sample computed by R-package spcosa (Walvoort et al.
2009
,
2010
)
area. Based on these 126 sampling locations, for each of the five contaminants
a map of the exceedance probabilities of a specified threshold concentration was
computed with indicator kriging. A second infill sample of 30 locations was
designed, using the maximum of the exceedance probabilities per contaminant as
weights (Fig.
4.11
). Several new sampling locations are located close to heavy
contaminated locations (Fig.
4.12
).
4.4.1.3 Geostatistical Sampling
In the previous section the sampling pattern was optimized in terms of a distance-
criterion. Alternatively, we may search for the sampling pattern that minimizes the
Search WWH ::

Custom Search