Database Reference
In-Depth Information
4.3 Modeling of IoT Application and Services
An IoT application is represented through a graph, which can be modeled visually.
A service graph describing a particular application can be created by dragging nodes
from the node-toolbox into the application workspace, setting them up and wiring them
together. Each graph node is color-coded to indicate its function and provides input and
output endpoints to facilitate connections. Each endpoint belongs to one or more
scopes while its position on the rendered node is dictated by its function (inputs on the
left, outputs on the right). The system allows only connections between endpoints that
have common scopes. Connections between nodes may be established by clicking on
an output endpoint and dragging a connection to another node
s input endpoint. While
a connection is dragged, the system will automatically highlight the endpoints that can
serve as the connection
'
s destination.
A service graph visualizes the information flow from a source (typically a sensor
type) to a sink (a visualization widget). Therefore, all service graphs should contain at
least one source node and one sink node. Other node types can be injected between the
source and the sink to manipulate the data (i.e. perform an aggregation or
'
ltering
function). The available node types are described in following paragraphs.
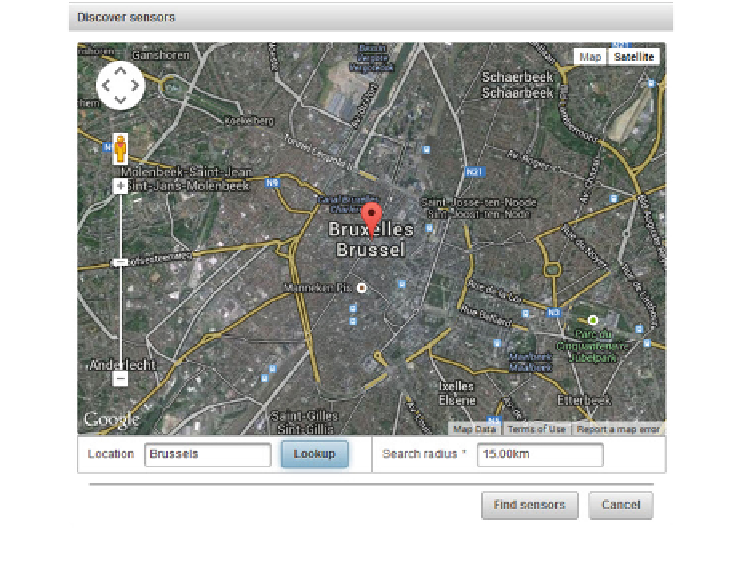
Data Source Nodes.
Data source nodes model the sensor types available for querying
via the OpenIoT middleware platform. In order to populate the list of available sensors,
a sensor discovery query has to be performed. By clicking the search button in the node
toolbox, a sensor discovery dialog appears (Fig.
3
), which enables search for sensors
Fig. 3. Sensor discovery dialog
Search WWH ::

Custom Search