Image Processing Reference
In-Depth Information
TABLE 10.15
Optimized Color Mixing Coef
cients
for Virtual Printer Model
C
M
Y
C
1
0
0
M
0
1
0
Y
0
0
1
C
þ
M
1.6308
1.4360
0
M
þ
Y
0
1.9811
2.2318
C
þ
Y
2.08
0
3.0025
C
þ
M
þ
Y
14.3163
16.0697
29.0905
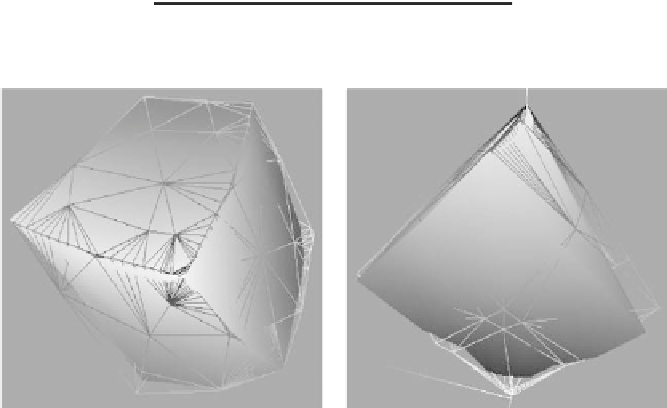
FIGURE 10.58
Two views of the color gamuts after color mixing coefficient optimization
(solid: real printer and wire mesh: virtual printer model).
because the virtual printer model does not capture the physics of the real printer in
that region. The other regions are also not well matched, which indicates an
opportunity for further investigation into optimizing the color mixing coef
cients.
10.7.4 O
NE
-D
IMENSIONAL
C
HANNEL
-W
ISE
TRC M
ATCHING
As a
final step, to match the virtual printer model to a real printer, we perform the
matching of single separation TRCs on paper (
D
E
a
*
from paper) of the virtual printer
model to the real printer. A complete methodology for TRC matching can be found
in Chapter 8. The original TRC of the virtual printer model, TRC of a real printer,
and TRC of the virtual printer model after performing 1-D channel-wise matching
for cyan channel can be seen in Figure 10.59. The TRC correction lookup table
(LUT) for the cyan channel is shown in Figure 10.60.

Search WWH ::

Custom Search