Image Processing Reference
In-Depth Information
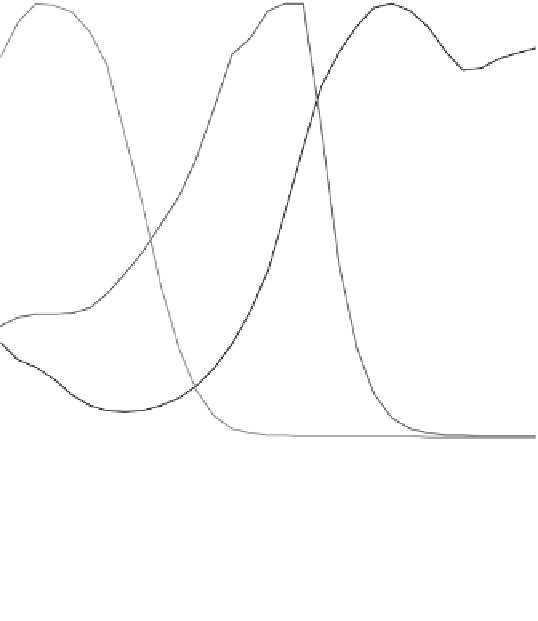
Toner master curves
1
0.9
0.8
Cyan
Magenta
Yellow
0.7
0.6
0.5
0.4
0.3
0.2
0.1
0
400
450
500
550
600
650
700
Wavelength (nm)
FIGURE 10.56
Toner master curves used for tuning the virtual printer model.
l
Solving Equations 10.75 and 10.76 for the toner master curve, M
C
(
), we obtain
h
i
Rm
C
;
ð
l
Þ
C
1
ln
R
s
(l) ln
C
2
M
C
(l) ¼
(
10
:
77
)
exp b
C
m
g
C
2
a
C
1
Since it is required to normalize the master curves in such a way that the maximum
value is 1, we can ignore the denominator. Hence,
MaxVal¼1
Rm
C
;
ð
Þ
C
1
C
2
l
M
C
(l)
ln
R
s
(l) ln
(
10
:
78
)
The master curves for the other two separations can be determined in a similar fashion.
Equation 10.78 gives the best approximation of master curves used in the virtual printer
model while trying to emulate a real printer. The toner master curves derived from a real
printer using Equation 10.78 are shown in Figure 10.56 for C, M, and Y toners.
10.7.2 T
UNING OF
S
INGLE
S
EPARATION
C
OEFFICIENTS
Equation 10.78 shows how to obtain the toner master curves from real experimental
data with paper white and 100% color patches. Below we show how to optimize the
single separation coef
cients based on the measurements made at various area
coverages along each of the primaries. For cyan or magenta or yellow channels, if
the primaries are not mixed, the transmittance (Equation 10.58) reduces to Equation
10.79. Similarly, the black channel is reduced to Equation 10.80:


Search WWH ::

Custom Search