Image Processing Reference
In-Depth Information
R
e
s
a
m
p
l
ed
i
m
age
to
r
e
f
l
ect
lase
r
s
ca
n
d
i
r
e
c
t
io
n
250
200
150
y
100
50
0
0
50
100
150
200
250
Fast scan
x
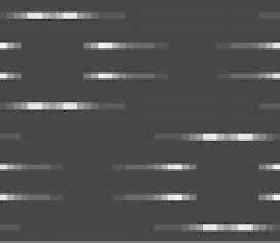
FIGURE 10.41
Upsampled halftone patch.
Results of la
s
er fast scan
R
esult
s
of l
a
ser f
as
t sca
n
5
10
15
10
8
6
20
25
30
35
4
2
0
0
10
40
30
20
20
30
40
10
40
0
5
10
15
20
25
30
35
40
Fast scan
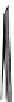
FIGURE 10.42
Effect of laser profile along fast-scan direction (a linear exposure profile).
Then the upsampled image is given by R(x)
¼Q(x)
S, where the symbol
stands
for Knocker product. The given S is obtained for p¼
5, for arbitrary p the scaling
matrix S had the same structure with ones along the appropriate row. Thus, if the
halftoned image is of size nn, the rescaled matrix will be of size npnp.In
the next stage, the upsampled image is convolved along the fast-scan direction
with a
filter representing the laser beam. This is being shown in Figure 10.42.
Here the trailing edges in the fast-scan direction show the effect of convolution.
The z-axis in the surf plot shows the photon intensity after convolution. This step
gives us the linear exposure pro
le (Table 10.12).
The
final ROS pro
le is obtained by convolving the linear exposure pro
le with
the Gaussian or sinc
2
filter along the slow-scan direction. This step models the


Search WWH ::

Custom Search