Image Processing Reference
In-Depth Information
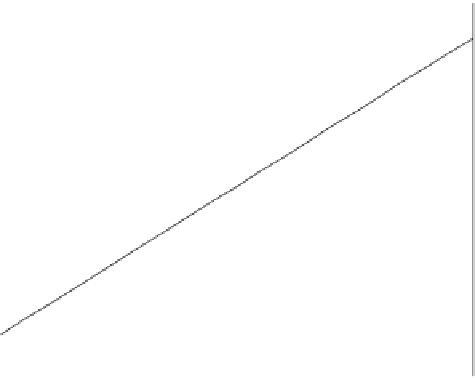
Gloss vs. temperature, TMA = 1 mg/cm
3
48
46
44
42
40
38
36
34
32
30
130
132
134
136
138
140
142
144
146
148
150
T
(°C)
FIGURE 10.27
Gloss vs. temperature for fixed TMA.
independent of temperature for the experimental fusing system and is obtained from
Figure 10.24.
2
G
¼
a
2
(
T
) (TMA)
þ
a
1
(
T
) TMA þ
a
0
(
10
:
53
)
At this point, it is constructive to note that, according to this model, the gloss (G)isa
linear function of temperature (T) for a
fixed TMA and a quadratic function of the
TMA (with a negative leading coef
fixed temperature (T). This depend-
ency is further visualized in Figures 10.27 and 10.28.
In Figure 10.28, the measured gloss decreases as the gray level or TMA increases.
Since the samples were only minimally fused, we can conclude that at low gray levels,
gloss is controlled primarily by the substrate and that at higher gray levels, the under-
fused, non-glossy toner covering the substrate reduces the contribution of the substrate
to the gloss. Apart from the toner, the gloss of the substrate is an important contrib-
uting factor to the overall gloss of the image.
cient a
2
) for
10.2.6 C
OLOR
M
ODEL
In this section, we describe a mathematical color model that can be found in Refs.
[28
ectance (R) at each wavelength, which is
the most complete characterization of the output color. The output re
-
30]. The model predicts the output re
ectance
curve, that is, the re
ectance with respect to wavelength (
l
), can then be used to
derive the tristimulus values in any of
the device-independent color spaces,
for example, L*, a*, b*orX, Y, Z.


Search WWH ::

Custom Search