Image Processing Reference
In-Depth Information
F
v
s
.
V
a
1
0.9
0.8
0.7
0.6
0.5
0.4
0.3
0.2
0.1
0
-200 -150
-100
-50
0
50
100
150
200
250
300
V
a
(
V
)
(a)
100% TE
(b)
Developed mass
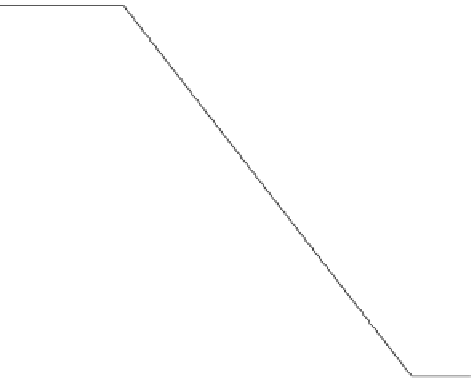
FIGURE 10.23
(a) Transfer efficiency F vs. V
a
and (b) relationship between transferred
mass to developed mass.
cm
2
), the space charge density can
be expressed in terms of toner radius R (in cm). Dependence of F on ratio V
a
is
shown in Figure 10.23a for the parameters shown in Table 10.8.
The
With
s
as the surface charge density (in
m
C
=
final transfer model is shown in Table 10.9, which captures the relationship
between the transfer ef
ciency and the transfer voltage. Transferred mass per unit
area (TMA) onto the paper from the DMA on the PR is obtained by the following
equation:
TMA ¼ DMA
F
(
10
:
52
)


Search WWH ::

Custom Search