Image Processing Reference
In-Depth Information
Photoreceptor
………
… … …
Customer
image area
Non optimal gray levels requiring
printing in the customer image area
(a)
Photoreceptor
Customer
image area
Customer
image area
Customer
image area
Optimal gray levels requiring only
minimal printing, which can be
performed in the inter document zone
(b)
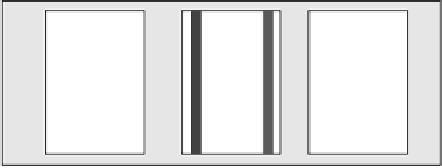
FIGURE 9.53
Photoreceptor showing calibration strips for on-belt sensing for calibrating
streak compensating TRCs.
TABLE 9.3
Optimal and Equispaced Gray Levels (0-255)
Number of Patches
Optimal Values
Equispaced Values
2
137, 233
65, 193
4
137, 169, 225, 233
33, 97, 161, 225
8
113, 137, 153, 169, 201, 225, 233, 241
17, 49, 81, 113, 145, 177, 209, 241
compared to the measured 32 levels. For each subset, the mean-square error
(MSE) over the 32 levels is plotted.
In Figure 9.54, the MSE for each of the 2-, 4-, and 8-level subsets is calculated
across the spatial dimension for all gray levels. The resulting data points are plotted
and it can be observed that the optimal-set error incurred by using the optimal gray
levels is roughly half of the equispaced-set error incurred by using the equispaced
levels.


Search WWH ::

Custom Search