Image Processing Reference
In-Depth Information
0.7
0.6
0.5
0.4
0.3
0.2
0.1
0
0
50
100
150
200
250
Print number,
k
0.4
0.35
0.3
0.25
0.2
0.15
0.1
0.05
0
0
50
100
150
200
250
(b)
Print number,
k
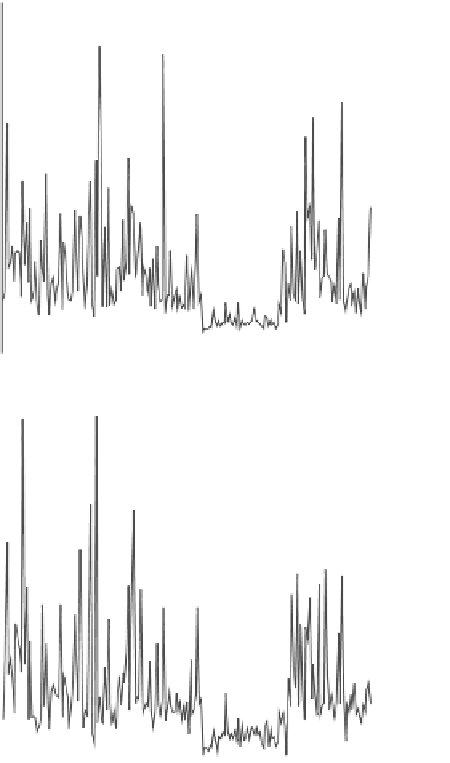
FIGURE 9.48 (continued)
Area coverage profile used for the TC control algorithm
(obtained using a scanner from magazine samples).
improved steady-state error as compared with the PI controller with Smith predictor
and a nonoptimized model predictive controller (not described in this topic).
The
ned as the ratio of the area under the curve
with disturbances and uncertainties to that without any such disturbance, is
calculated by measuring the area under the response curve with respect to the
target. In our comparison, the ideal
figure of merit, which is de
figure of merit is a step response from 3% to
4%. When the TC response is above the target value, then it is subtracted from the
required area. The
figure of merit in Table 9.2 shows overall improvement can be
achieved with state feedback methods. More advanced methods such as model
predictive controller can be further optimized to work similar to or better than the
state feedback method for the same problem.


Search WWH ::

Custom Search