Image Processing Reference
In-Depth Information
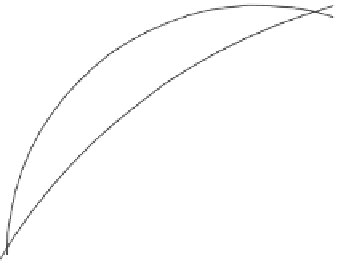
Controllable space for level 2
Actual TRC
100%
75%
Ideal TRC curve
50%
25%
25%
50%
75%
100%
% Area coverage (input)
FIGURE 9.17
Schematic diagram representing the TRC with controllable space using
process actuators (charge and development bias).
Actual TRC
100%
75%
50%
25%
Compensation or
TRC inverse
50%
75%
100%
25%
% Area coverage (input)
FIGURE 9.18
Schematic diagram representing the inverse TRC obtained to achieve the
desired reference TRC.
level 3 controls, since these higher level controls can provide extra degrees of freedom
that lower level (charge and developability) controls cannot. The level 3 control
system generates the inverse curve (Figure 9.18) for each separation [26]. This
curve can be obtained by inverting the measured TRC over a reference TRC.
In another scenario presented in Figure 9.19, it appears as though there is
suf
cient actuator space to obtain the desired tone curve. However, we are still not
able to reach full inversion with three point level 2 controls because of insuf
cient
sampling; sampling of only three (low, mid, and high area coverages) is suf
cient for
inversion. A time-sequential sampling proposed in Ref. [15] may provide reliable
control for such systems for a given area coverage (or gray level); during each


Search WWH ::

Custom Search