Image Processing Reference
In-Depth Information
0.375
0.0398
0.138
0.137
0.0396
0.370
0.136
0.0394
0.365
0.135
0.0392
0.360
0.134
0.0390
0.355
0.133
0.0388
0.350
0.132
0.345
0.0386
0.131
0.340
0.0384
0.130
0.129
0.335
0
5
10
15
20
25
30
35
40
45
50
0
5
10
15
20
25
30
35
40
45
50
0
5
10
15
20
25
30
35
40
45
50
(a)
30x Pitch #
30x Pitch #
30x Pitch #
-580
-300
-100
-600
-310
-105
-620
-320
-640
-110
-660
-330
-115
-680
-340
-700
-120
-350
-720
-740
-125
-360
0
5
10
15
20
25
30
35
40
45
50
0
5
10
15
20
25
30
35
40
45
50
0
5
10
15
20
25
30
35
40
45
50
(b)
30x Pitch #
30x Pitch #
30x Pitch #
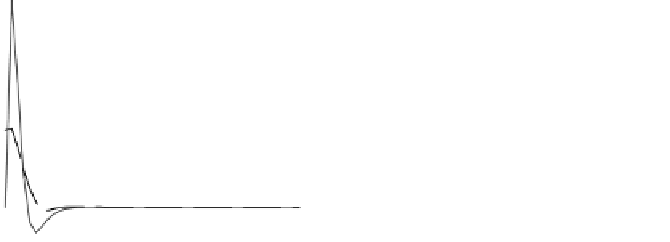
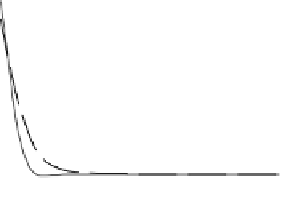
FIGURE 9.15
(a) Responses of the DMA vector. Samples are shown at 30 pitch interval. (b) Responses of the actuator vector. Samples are shown
at 30 pitch interval. Solid curve represents P
1
¼
P
2
¼
P
3
¼
0
:
3 and dashed curve represents P
1
¼
P
2
¼
0
:
3 and P
3
¼
0
:
7. All DMA values are shown in
mg
=
cm
2
units.
(continued )


Search WWH ::

Custom Search