Image Processing Reference
In-Depth Information
250
200
150
100
50
0
0
50
100
150
200
250
C
in
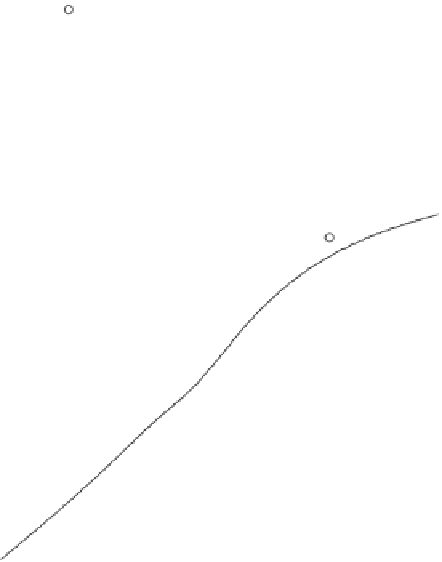
FIGURE 8.15
Cyan gray-balanced TRC for pole-placement design.
250
200
150
100
50
0
0
50
100
150
200
250
M
in
FIGURE 8.16
Magenta gray balanced TRC for pole-placement design.
Figure 8.18 is an example of a cyan TRC shown with typical highlight and shadow
regions. Determining TRCs using a calibration approach with interpolation, curve
fitting, or smoothing as described above works well for most of the range of digital
values. However, it does not work well for highlights or shadows in high-end printing
systems, particularly those of electrophotographic printers.
Calibration data for highlights is dif
cult to produce because the print engine is
not capable of reliably depositing a small amount of toner and the sensing of the
color in highlight region can be very noisy. Most marking engines can reliably


Search WWH ::

Custom Search