Image Processing Reference
In-Depth Information
100
0
L
*=10
L
*=20
L
*=30
L
*=40
L
*=50
90
80
50
70
L
0
100
60
L
*=60
L
*=70
L
*=80
L
*=90
L
*=100
50
α
150
40
η
30
200
20
10
250
0
250
200
150
100
50
0
-100 -80 -60 -40 -20
0
20
40
60
80
100
Black digital count
a
*,
b
*
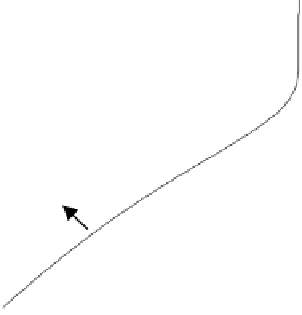
FIGURE 7.42
A graph of K-restricted multidimensional GCR function generated with
a¼
0.01,
b¼
1.5, and
h¼
0.5. (a) L* with respect to K digital
count (left), (b) color gamut (center), and (c) K digital count with respect to a* and b*.


Search WWH ::

Custom Search