Image Processing Reference
In-Depth Information
45
120
95%
Max
Mean
95%
Max
Mean
40
100
35
30
80
25
60
20
15
40
10
20
5
0
0
1
2
3
4
5
6
7
8
9
10
1
2
3
4
5
6
7
8
9
10
No. of basis vectors
No. of basis vectors
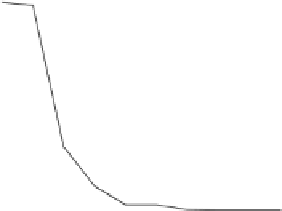
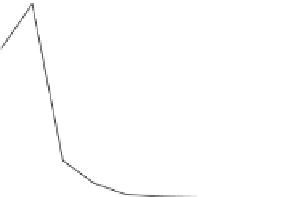
FIGURE 7.15 D
E
2000
and
D
E
a
*
as function of the number of basis vectors for training
colors.
TABLE 7.1
D
E Numbers Are Shown to Indicate
the Approximation Accuracy
Number of
Basis Vectors
D
E
a
*
D
E
2000
1
23.95
60.92
2
21.02
62.28
3
3.41
8.82
4
2.69
5.91
5
0.35
1.09
6
0.05
0.14
2
4
3
5
b
1
b
2
::
b
K
a
11
a
12
::a
1K
½
W
1
W
2
::
W
K
¼ [
1 CMYK
]
a
21
a
22
::a
2K
(
7
:
46
)
a
31
a
32
::a
3K
a
41
a
43
::a
4K
W
T
¼
A
0
u
0
Where W
T
[W
1
W
2
..W
K
] is a row vector containing K number of weights for the
ith color. When N number of colors are used in the training set, WT
T
will be a matrix
of size N
K. A
0
contains N number of rows, and CMYK values with a suitable
structure of the model (linear af
¼
u
0
contains the new
parameter matrix with K number of columns. Equation 7.46 is very similar to
Equation 7.3. Hence, the least-square solution to the parameter matrix is given by
ne, quadratic, cubic, etc.), and
1
A
0
W
T
u
0
¼
A
0
A
0
(
7
:
47
)


Search WWH ::

Custom Search