Environmental Engineering Reference
In-Depth Information
FIGURE 4.11
The results of calculations of fluid flow in the nanotube.
The typical size of crystallite is 1-2 nm, that is,compared, for example, with a
diameter of silica nanotubes of different composition and structure.
The flow model proposed in the present work is based on the presence of
“quasi-solid” phase in the central part of the nanotube and liquid layer, non-au-
tonomous phases [23].
Consideration of such a structure that is formed when fluid flows through the
nanotube, is also justified by the aforementioned results of the experimental stud-
ies and molecular modeling.
When considering the fluid flow with such structure through the nanotube, we
will take into account the aspect ratio of “quasi-solid” phase and the diameter of
the nanotube. Then the character of the flow is stable and the liquid phase can be
regarded as a continuous medium with viscosity
h
.
Let's establish relationship between the volumetric flow rate of liquidflowing
from a liquid layer of the nanotube lengthl,
l
, the radius
R
and the pressure drop
,
, where,
p
0
is the initial pressure in the tube (Fig. 4.12).
D
p
=
p
−
p
D
p
/
l
0
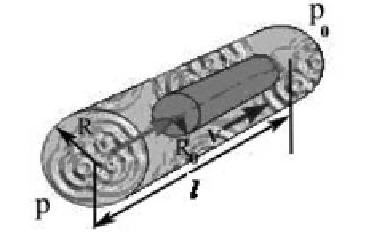
FIGURE 4.12
Flow through liquid layer of the nanotube.
Let
R
0
be a radius of the tube from the “quasi-solid” phase and
v
- velocity of
fluid flow through the nanotube.

Search WWH ::

Custom Search