Environmental Engineering Reference
In-Depth Information
The value of the flow rate and the system pressure, which varies in the range
of 600-800 bars, were high enough to ensure complete filling of the tubes. This
pressure was achieved by the total number of water molecules 736, 904, and 1694,
respectively.
The effects of slippage of various liquids on the surface of the nanotube were
studied in detail.
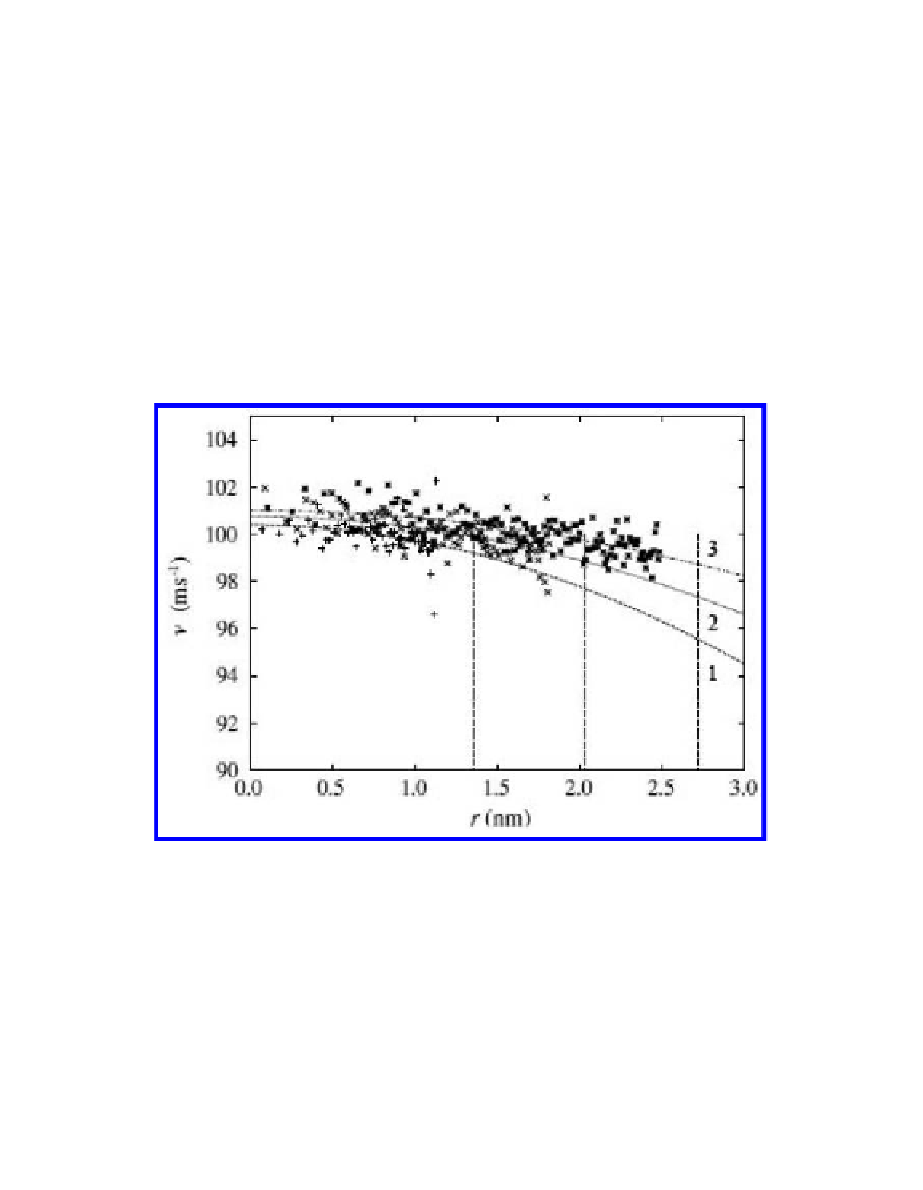
The length of slip, calculated using the current flow velocity profiles of liquid,
shown in Fig. 3.2, were 11, 13, and 15 nm for the pipes of 2712, 4068 and 5424
nm, respectively. The dotted line marked by theoretical modeling data. The verti-
cal lines indicate the position of the surface of carbon nanotubes.
It was found out that as the diameter decreases, the speed of slippage of par-
ticles on the wall of nanotube also decreases. The report attributes this to the
increase of the surface friction.
FIGURE 3.2
Time average streaming velocity profiles of water in a carbon nanotubes of
different diameter: 2.712 nm, curve 1; 4.068 nm, curve 2; 5.424 nm, curve 3.
Experiments with various pressure drops in nanotubes demonstrated slippage
of fluid in micro and nanosystems. The most remarkable were the two recent
experiments, which were conducted to improve the flow characteristics of carbon
nanotubes with the diameters of 2 and 7 nm, respectively.
In the membranes in which the carbon nanotubes were arranged in parallel,
there was a slip of the liquid in the micrometer range. This led to a significant
increase in flow rate, up to three and four orders of magnitude.
Search WWH ::

Custom Search