Geoscience Reference
In-Depth Information
MSLP
SFC TEMPERATURE
PRECIPITATION
Mean sea level pressure
Mode 1 Phase
=
0
1.5
m temperature
Mode 1 Phase
=
0
Total precipitation rate
Mode 1 Phase
=
0
0
°
60
N
30
N
0
30
S
180
60
N
30
N
60
N
30
N
0
30
180
0
30
180
90
W
0
90
E
180
90
W
0
90
E
180
90
W
0
90
E
180
-1.6
-0.3
-0.1
0.1
0.3
1.6
-0.8
-0.2
-0.05
0.05
0.2
0.8
-0.5
-0.1
-0.05
0.05
0.1
0.5
Mean sea level pressure
Mode 1 Phase
=
45
1.5
m temperature
Mode 1 Phase
=
45
Total precipitation rate
Mode 1 Phase
=
45
45°
60
N
30
N
0
30
S
180
60
N
30
N
0
30
180
60
N
30
N
0
30
S
180
90
W
90
E
90
W
90
E
0
180
0
180
90
W
0
90
E
180
-1.6
-0.3
-0.1
0.1
0.3
1.6
-0.8
-0.2
-0.05
0.05
0.2
0.8
-0.5
-0.1
-0.05
0.05
0.1
0.5
1.5
m temperature
Mode 1 Phase
=
90
Total precipitation rate
Mode 1 Phase
=
90
Mean sea level pressure
Mode 1 Phase
=
90
90°
60
N
60
N
60
N
30
N
0
30
S
180
30
N
0
30
S
180
30
N
0
30
S
180
90
W
90
E
90
W
90
E
90
W
90
E
0
180
0
180
0
180
-1.6
-0.3
-0.1
0.1
0.3
1.6
-0.8
-0.2
-0.05
0.05
0.2
0.8
-0.3
-0.1
-0.05
0.05
0.1
0.3
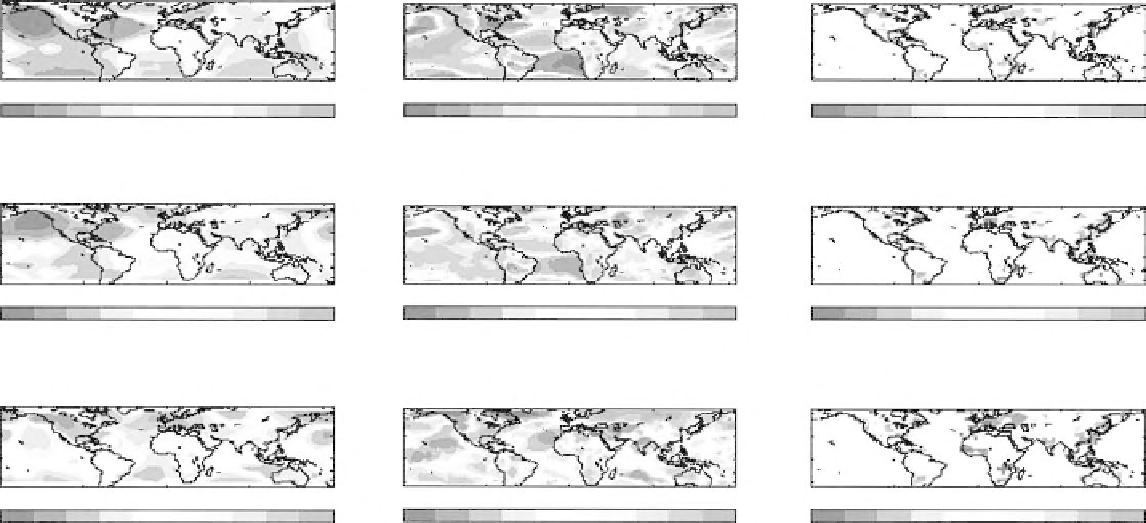
Figure 2.9 Canonical patterns of the spatiotemporal evolution of co-varying 11.6 year LFV peak quasi-decadal MSLP, surface temperature, and precipitation
signals at 0, 45 and 90 degrees of phase over the domain 65
8
Nto35
8
S from an MTM-SVD analysis using data from 1900 to 1998. MSLP, surface temperature,
Search WWH ::

Custom Search