Geoscience Reference
In-Depth Information
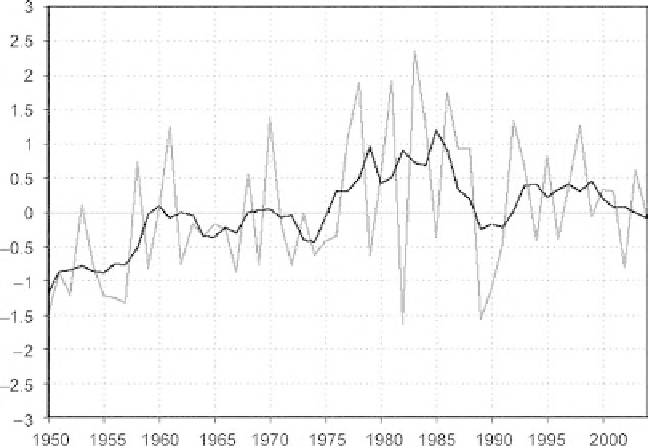
Figure 2.3 Seasonal mean
of the PNA Index. Note the
trends of the positive and
negative values of the index.
Figure
2.3
shows the seasonal PNA Index for the period 1950 to 2004. When
the index is positive, there is a strong Aleutian Low and a strong ridge over
western Canada. In the negative phase the pattern is quite different, lacking the
strong ridges and troughs with a more zonal flow in effect.
There have been a number of studies linking the PNA to climate anomalies in
North America. In a two-part study of the role of the PNA in the United States
Leathers et al.(
1991b
) found a number of meaningful relationships. They
demonstrated that regional temperatures and precipitation are highly correlated
to the PNA Index across the United States especially in winter. Correlations for
precipitation were less extensive than those of temperature but clear relationships
were obtained. The authors used the PNA Index to corroborate earlier research
suggesting a major change in mid-tropospheric circulation in the late 1950s.
An interesting study related winter moisture conditions in the Ohio Valley to
the PNA (Coleman and Rogers
1995
). It was found that the PNA Index was
strongly linked to moisture variability in an area extending from southeast
Missouri to Ohio, with a very strong correlation in southern Indiana. They also
noted that the mean streamflow of the Ohio River in winter had discharges up to
100% higher in PNA-negative winters compared to PNA-positive winters. The
incidence of cyclones in the Great Lakes region of North America was the topic
of research by Isard (
1999
). The study supported the observation that more Great
Lakes cyclones originate from the northwest at those months when PNA-positive
occurs, while cyclones from the west and southwest occur more often with a
PNA-negative index. From these studies, and others like them, it is clearly
evident that the PNA plays a significant role in the climates of North America.
Search WWH ::

Custom Search