Geoscience Reference
In-Depth Information
(a)
200
Figure 4.10
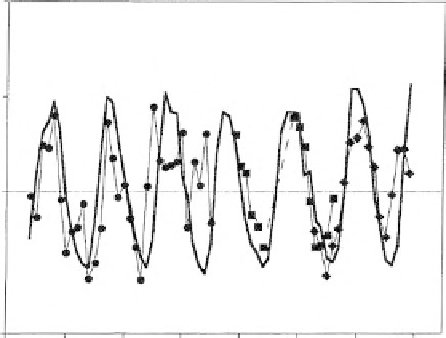
(a) Relationship between
number of days with strong
zonal westerly winds (ZWW)
over SE Australia (circles) and
the sunspot cycle (solid line).
(b) Sunspot cycle versus
South American (circles),
South African (squares) and
Australian (diamonds)
pressure-difference time
series (three-point
unweighted running mean).
(After Thresher
2002
,
Figures 1 and 3, Copyright
John Wiley & Sons Ltd., with
permission)
2500
100
1250
0
0
1940
1950
1960
1970
Year
1980
1990
2000
2010
(b)
4
2
0
-3
1920
1930
1940
1950
1960
1970
1980
1990
Year
circulation. How these forcing mechanisms operate is not very well known, and
there is controversy over interpretations. Despite considerable negative discus-
sion in the past, there is support for the role of sunspots and their changes over
time as a mechanism leading to changes in mid-latitude climate variability. For
example, Thresher (
2002
) states that there is a relationship between the sunspot
cycle and changes in SH general circulation. Sunspot variations cause changes
in shortwave solar radiation, which then affects changes in stratospheric wind
speed and zonality. His argument is summarized in Figure
4.10
, which shows
the sunspot cycle since 1940, the frequency of occurrence of strong zonal
westerly winds over SE Australia, and the relationship with pressure time
series. Sunspot amounts cycle with a periodicity of approximately 11 years.
Strong zonal westerly winds between 1940 and 2000 show a periodicity of
10-13 years.
At least in the Australian region, Thresher (
2002
) hypothesizes that there is a
relationship between the sunspot cycle and the location of the subtropical ridge.

Search WWH ::

Custom Search