Geoscience Reference
In-Depth Information
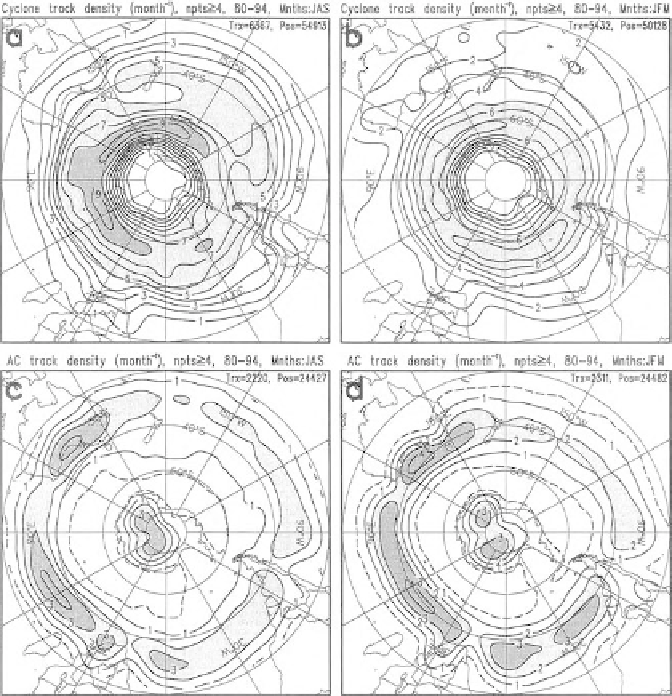
Figure 4.9 Mean monthly
cyclone and anticyclone
track densities (lasting
two or more days) for
(a) cyclone winter;
(b) cyclone summer;
(c) anticyclone winter;
(d) anticyclone summer. The
scale is every one system per
5
8
latitude radius-circle per
month; values
>
5 and
>
8
shaded. (From Karoly et al.
1998
based on data
provided Sinclair
1995
,
1996
: permission from
American Meteorological
Society)
Cyclones
In terms of the SH, cyclonicity is dominated by the CPT around Antarctica (see
Chapter
5
). Leighton (
1994
) and Sinclair (
1995
) used techniques such as geo-
strophic relative vorticity rather than minimum pressure to remove the CPT bias
and allow a focus on cyclones and their movements in the mid-latitudes.
Cyclones represent the majority of mid-latitude weather systems, with a max-
imum in the storm track between 45 and 508 S. In winter, the Pacific dominates
the formation area, with frequencies in July averaging about 30. There is a
relationship between the strength and location of the SPCZ (see Section
3.2.2
)
and areas of stronger SST gradient. These areas provide the strongest baroclinic
instability and enhanced convection of heat. Maximum frequencies occur in
the New Zealand region, the east coast of South America, and SE of Southern
Africa extending across the Indian Ocean (see Figure
4.9
). Chen and Yen (
1997
)
suggest that cyclones in the last two areas have deepened in strength between
Search WWH ::

Custom Search