Geoscience Reference
In-Depth Information
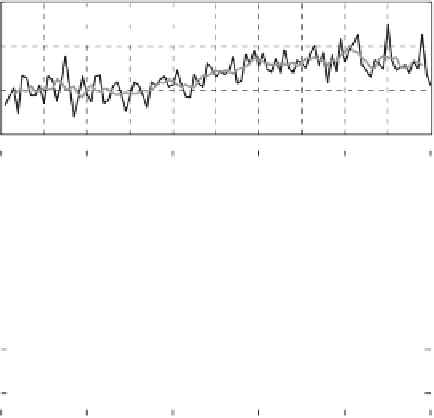
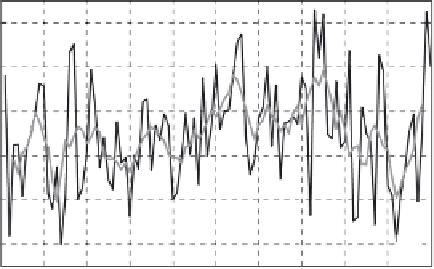
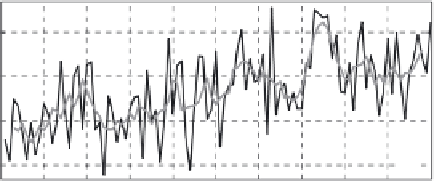
Figure 4.5 Annual (black
line) and five-year running
(gray line) mean
precipitation bands that
cover 30%, 40% and 30% of
the global area. (Source:
NASA:GISS)
1.7
Northern latitudes
(90°
N-24°
N)
1.6
1.5
(a)
1.4
4.3
4.2
4.1
4.0
3.9
Low latitudes
(24°
N-24°
S)
3.8
(b)
Southern latitudes
(24°
S-90°
S)
2.1
2.0
1.9
1.8
(c)
1900
1920
1940
1960
1980
2000
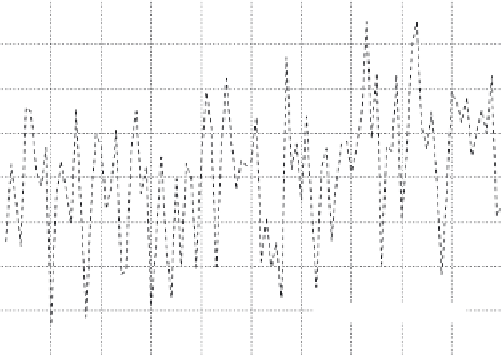
2.4
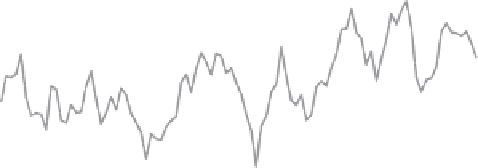
Figure 4.6 Annual and
five-year running mean
precipitation in the
contiguous United States.
(Source: NASA:GISS)
2.2
2.0
1.8
Annual mean
5-year mean
1.6
1900
1920
1940
1960
1980
2000


Search WWH ::

Custom Search