Environmental Engineering Reference
In-Depth Information
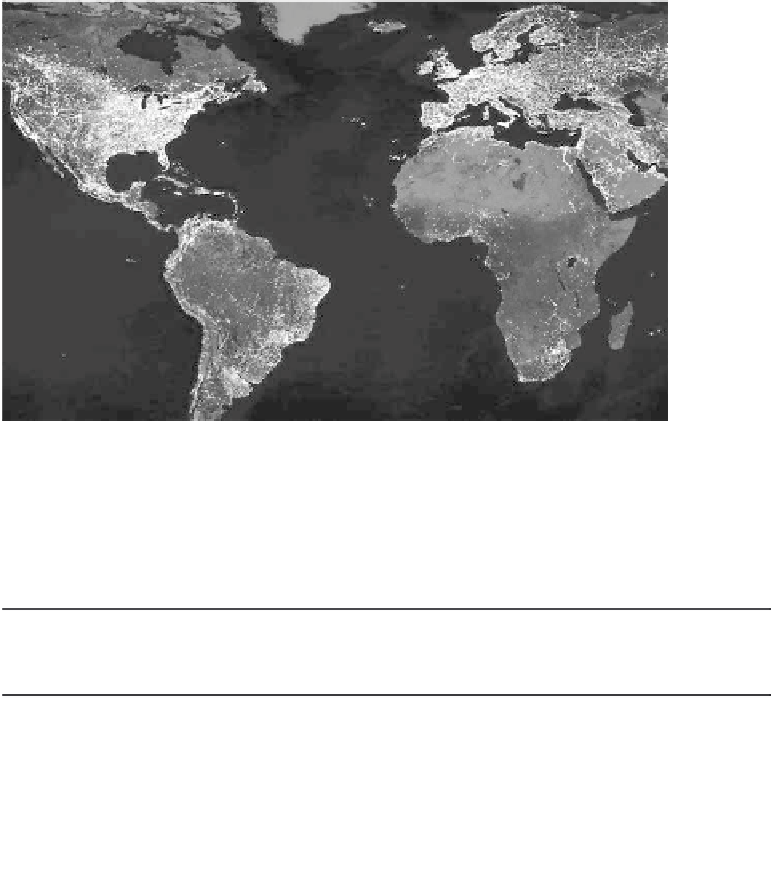
Perhaps nothing illustrates the extent of the anthropogenic Earth better than the composite
of nighttime satellite images by NASA. The i le can be downloaded at http://eoimages.gsfc
.nasa.gov/images/imagerecords/0/896/earth_lights_lrg.jpg.
Table 12.1
Some Important Global Trends
Life
Expectancy
(years)
Global
Phytomass
Stock (Gt C)
Population
(million)
Energy Use
(GJ/capita)
Economic Product
(2000, $/capita)
Year
5,000 BP
20
<
3
<
100
20
>
1,000
0
200
<
5
500
<
25
1,000
1000
300
500
900
<
10
<
30
1800
900
23
600
35
750
1900
1,600
27
1,200
40
660
2000
6,100
75
6,500
67
600
2010
6,900
75
7,500
69
<
600
Note:
All of these values (with the exception of the post-1900 population, energy, and life
expectancy) are just approximations. Economic product and phytomass stock series have
the highest (at least
15%) uncertainty. Population series are available in McEvedy and Jones
(1978) and HYDE (2011). Average per capita energy use is based on Smil (2008, 2010b).
Economic product estimates are based on Maddison (2007). Global phytomass stocks are
based on data in table 2.4.
±