Information Technology Reference
In-Depth Information
0.45
Error rate
0.4
0.35
0.3
0.25
0.2
0.15
0.1
0.05
n
0
0
50
100
150
200
250
(a)
0.18
Error rate
0.16
0.14
0.12
0.1
0.08
0.06
0.04
0.02
n
0
0
50
100
150
200
250
(b)
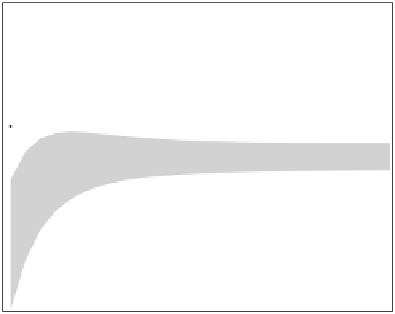
Fig. 3.13 Learning curves for the Gaussian problem of Example 3.7 (bottom) and
the circular uniform problem of Example 3.8 with
r
1
=3
(top), using respectively
the
H
R
2
-MEE and the
H
S
-MEE perceptron. The learning curves (solid lines) were
obtained by exponential fits to the
P
ed
(
n
)
(denoted '+') and
P
et
(
n
)
(denoted '.')
values. The shadowed region represents
P
ed
± s
(
P
ed
)
; the dashed lines represent
P
et
± s
(
P
et
)
.
Similar results were obtained when using different numbers of instances
per class, reflecting different values of the priors
p
and
q
.
Briefly, these (and other) experiments provide experimental evidence that
the (empirical) MEE perceptron learns consistently and converges towards
the
min
P
e
classifier,
for
the
Gaussian
and
circular
uniform
input
distributions.