Information Technology Reference
In-Depth Information
x
2
^
E
(e)
1
0.6
0
0.5
0.4
−1
x
1
e
0.3
0
1
2
3
4
−1
−0.5
0
0.5
1
Error Rate (Test) = 0.003
1.5
1
^
Error Rate
S
0.8
0.6
1
0.4
0.2
epochs
epochs
0.5
0
0
20
40
60
0
20
40
60
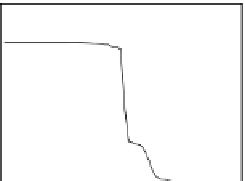
Fig. 3.12 The final converged solution of Example 3.8. The downside graphs of
the Shannon entropy and the error rate (solid line for the training set and dashed
line for the test set) are in terms of the no. of epochs.
Tabl e 3 . 1
P
ed
(300)
± s
(
P
ed
(300))
and
min
P
e
values for the distributions of Ex-
amples 3.7 and 3.8. Equal priors are assumed.
Circular uniform distributions
Parameters
(
a
)
P
ed
(300)
± s
(
P
ed
(300))
min
P
e
μ
11
=2
,r
1
=1
.
2
0
.
0161
±
0
.
0071
0.0160
μ
11
=3
,r
1
=2
.
5
0
.
0258
±
0
.
0061
0.0253
μ
11
=3
,r
1
=3
.
0
0
.
0549
±
0
.
0113
0.0540
Gaussian distributions
Parameters
(
b
)
P
ed
(300)
± s
(
P
ed
(300))
min
P
e
T
,
0
.
1587
(
c
)
μ
1
=[20]
Σ
1
=I
0
.
1595
±
0
.
0169
1
.
20
02
T
,
μ
1
=[20]
Σ
1
=
0
.
1634
±
0
.
0159
≈
0
.
1697
1
.
10
.
3
0
.
31
.
5
T
,
μ
1
=[1
.
50
.
5]
Σ
1
=
0
.
2261
±
0
.
0156
≈
0
.
2281
(
a
)
T
,r
−
1
=1
,μ
12
=0
;
(
b
)
μ
−
1
=[00]
T
,
Σ
−
1
=
I
;
(
c
)
exact value.
μ
−
1
=[00]
matrices as we mentioned in 3.2.1 (formula (3.34)); the work [191] provides,
however, for the general case, the means of computing an approximation of
min
P
e
, with a deviation reported to be at most 0
.
0184.