Information Technology Reference
In-Depth Information
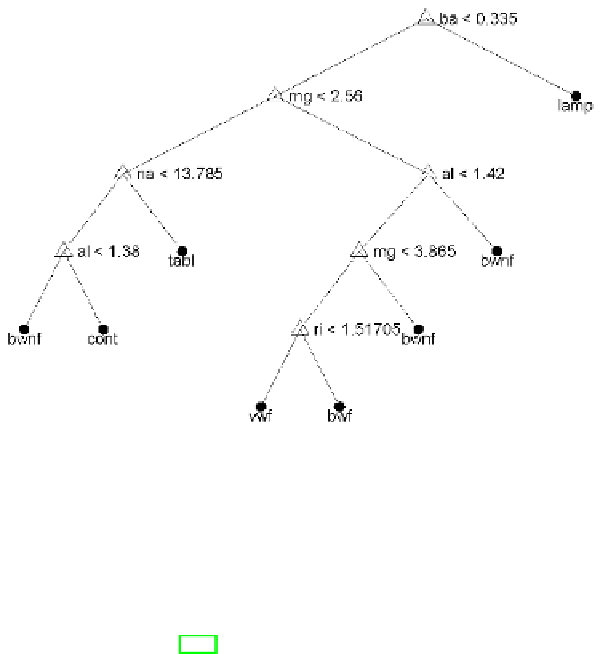
Fig. 6.39 CCP-pruned MEE tree for the Glass dataset. The decision rules are
expressed in terms of inequalities involving data features (chemical elements and
refractive index). A class label is shown below each tree leaf.
feature types. In this work resubstitution and leave-one-out estimates of the
error were computed (except for a few large datasets where 5-fold stratified
cross-validation was used).
In the following work [153] the study involved 42 datasets (from [13], ex-
cept the colon, central nervous system and leukemia datasets which are from
the Kent Ridge Biomedical Dataset [138]). All datasets were analyzed with
10-fold stratified cross-validation. In both works statistics regarding the tree
sizes in the cross-validation experiments were also computed. The statisti-
cal methods used in the multiple comparison assessment of the algorithms
followed recommendations in [51, 79, 249, 195] (see details in [152, 153]).
In the cited works [152, 153] no statistically significant difference among
the algorithms was found in what regards error performance; however, a
significant difference did emerge when comparing tree sizes. We now provide
the main evidence on these issues.
Table 6.28 shows the cross-validation estimates of the error rate for the 42
datasets analyzed in [153], with the best MEE solution for class unions up to
. The total number of wins (smallest error) and losses (highest error) are
also shown in Table 6.28 with the chi-square test
p
: no significant difference
is found relative to the equal distribution hypothesis. The Friedman test did
not detect significant differences (
p
= 0.453). Other statistical tests confirmed
these findings.
Table 6.29 shows the averages and ranges of tree sizes achieved in the cross-
validation experiments by all algorithms. The total number of wins (smallest
c
/
2