Biology Reference
In-Depth Information
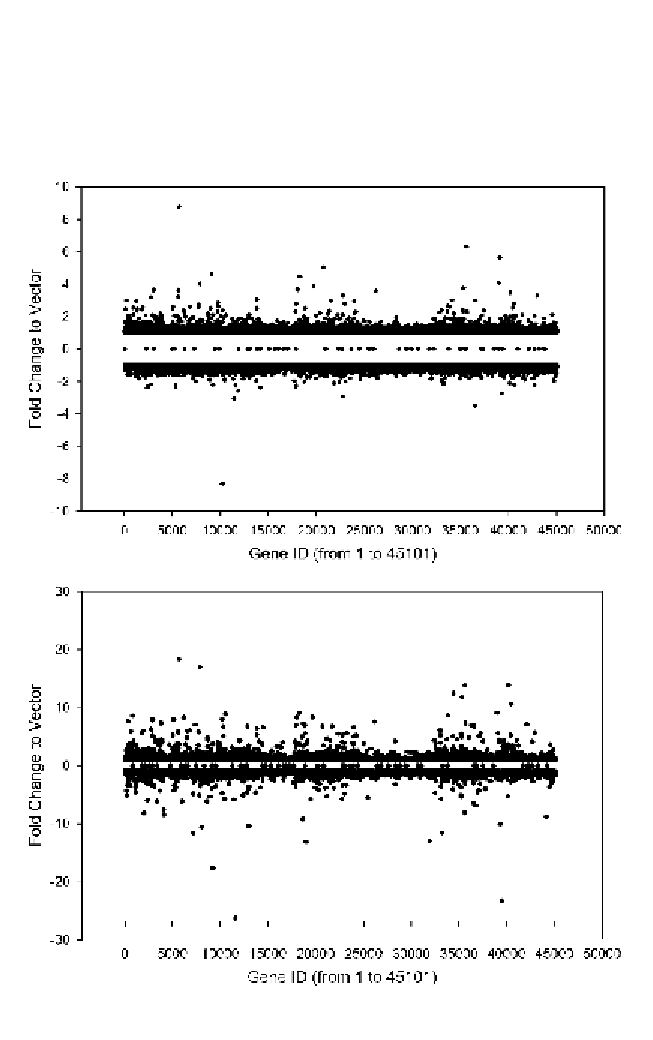
Array preprocessing and fold-change analysis are conducted for each
time point/batch separately. The microarray expression data used involved
45 101 genes. Data distribution at the 12-hour time spot is shown in Fig. 4.2
for P190, P210, and P230 samples, respectively.
(a)
(b)
Fig. 4.2.
(a)
P190 raw data.
(b)
P210 raw data.
(c)
P230 raw data.


Search WWH ::

Custom Search